Thunderstorms form when moist, unstable air is lifted upward into the atmosphere. Processes that can initiate vertical lifting and thunderstorm development include:
- Unequal warming of the surface of the Earth.
- Orographic obstruction of airflow.
- The presence of a frontal zone.
Immediately after the lifting process begins, the rising cell of warm moist air begins to cool because of a process known as adiabatic expansion (Figure 8.2). At a specific elevation, the dew point is reached, resulting in condensation and the formation of a cumulus cloud. For the cumulus cloud to develop into a thunderstorm, additional uplift must occur in an unstable atmosphere. With the vertical extension of the air cell, the cumulus cloud transforms into a cumulonimbus cloud. Cumulonimbus clouds can reach heights of about 20 km (12.4 mi) above the Earth's surface. Severe weather associated with some of these clouds includes hail, strong winds, thunder, lightning, heavy rain, and tornadoes (Figures 8.3 and 8.4).
Geographic Distribution of Thunderstorms
Roughly 40,000 thunderstorms occur each day on our planet. Thunderstorms form from the equator to as far north as Alaska. Most of these storm systems develop in the tropics, where convectional heating of moist surface air occurs year-round. On average, tropical land-based locations experience over 100 thunderstorm days per year. Thunderstorm formation over tropical oceans is less frequent because these surfaces do not warm rapidly. Outside the tropics, thunderstorm formation is more seasonal, occurring in those months when solar heating is most intense.
Figure 8.5 describes the annual average number of thunderstorm days across the United States. According to this map, the greatest incidence of thunderstorms occurs in the Southeast and parts of Colorado, Arizona, and New Mexico. This particular spatial distribution suggests that solar heating is only one of several requirements for thunderstorm formation. Another essential prerequisite is the availability of warm, moist air. The Gulf of Mexico supplies adjacent continental areas with moist, maritime tropical air masses in the United States. These moist air masses are usually quite unstable and, as a result, produce many cumulonimbus clouds when surface heating is intense. The secondary maximum found in Colorado and New Mexico is due to another climatic factor. All of these areas are mountainous. Mountain slopes in these areas that face the Sun absorb more direct solar radiation and become relatively warmer, creating strong updrafts that form cumulus clouds. If winds from the east also supplement the differential heating, the cumulus clouds are further enhanced by orographic uplift and become thunderstorms. Notice that only a few thunderstorms occur along the west coast of the United States. This region of the United States is frequently influenced by cooler maritime air masses that suppress convectional lifting over land.
Air Mass Thunderstorms
The most common type of thunderstorm is known as the air mass thunderstorm. In this common weather event, thunderstorms develop in an extensive air mass with the right temperature and humidity characteristics to form many isolated storm cells. Air mass thunderstorms often develop in the late afternoon, when surface heating produces the maximum number of convection currents in the atmosphere.
The life cycle of air mass thunderstorms has three distinct stages (Figure 8.6). The first stage of air mass thunderstorm development is called the cumulus stage (Figure 8.7). In this stage, a cell of warm, humid air rises and cools to form a puffy white cumulus cloud. Vertical cloud growth during this stage occurs at a rate of 18 to 72 kph (10 to 45 mph). Cumulus clouds form due to the condensation of water vapor into liquid water droplets — this conversion of water from gas to liquid releases large amounts of latent heat. The added latent heat energy keeps the air inside the expanding cumulus cloud warmer than the surrounding air. This warmer air also causes circulation inside the cloud to be dominated by updrafts.
The thunderstorm cloud continues to develop as long as more humid air is added to it from below. When the updrafts reach their maximum altitude in the developing cloud, usually 12 to 14 km (7.5 to 9 mi), they change their direction 180 degrees and become downdrafts. This occurrence marks themature stage. With the downdrafts, rain begins to form through collision and coalescence. The storm is also at its most intense stage of development and is now classified as a cumulonimbus cloud (Figure 8.8). The top of the cloud takes on the usual anvil shape, as strong upper-air winds now distribute ice crystals horizontally at the top of the cloud. At its base, the air mass thunderstorm is several kilometers (miles) in diameter. A mature air-mass thunderstorm produces heavy rain, thunder, and lightning, and generates wind gusts directed toward the ground.
The mature thunderstorm begins to decrease in intensity and enters thedissipating stageafter about 30 minutes. Air currents within the convective storm are now mainly downdrafts as the supply of warm, moist air from the lower atmosphere is depleted. The storm is now finished, and precipitation has stopped about 1 to 3 hours after its birth.
Severe Thunderstorms
Most thunderstorms are of the simple air mass variety. However, some can develop into more severe storms if the right conditions exist to enhance and prolong the mature stage. Severe thunderstorms can be defined as convective storms with frequent lightning, accompanied by local wind gusts of 97 kph (60 mph) or hail that is 2 cm (3/4 of an inch) in diameter or larger. Severe thunderstorms can also have tornadoes! Further, severe thunderstorms tend to have a geographic distribution quite different from that of common air mass types (Figure 8.9).
In most severe thunderstorms, the storm's movement can replenish its supply of warm, humid air. With a continual supply of warm, humid air and latent heat energy, the updrafts and downdrafts within the weather system become balanced, and the storm maintains itself for many hours. Movement of the severe storm is usually caused by the presence of a mid-latitude cyclone cold front or a dry line some 100 to 300 km (60 to 180 mi) ahead of a cold front. In the spring and early summer, frontal cyclones are everyday weather events that move from west to east in the mid-latitudes. At the same time, the ground surface in the mid-latitudes is receiving higher insolation. Higher insolation generates more heat and creates ideal conditions for air mass thunderstorm formation. When a frontal cyclone's cold front or dry line encounters this warm air, it pushes it like a bulldozer, both horizontally and vertically. If this air has high humidity and extends eastward, the movement of the mid-latitude cyclone enhances vertical uplift in storms and keeps thunderstorms supplied with moisture and latent heat. Thus, the mid-latitude cyclone converts air mass thunderstorms into severe thunderstorms that last for many hours. Severe thunderstorms dissipate only when no more warm, moist air is supplied. This condition occurs several hours after nightfall, when the atmosphere cools off.
Figures 8.10 and 8.11 illustrate the features associated with a severe thunderstorm. This storm would move from left to right because of the motion associated with a mid-latitude cyclone. The upper-level dry air wind is generated from the mid-latitude cyclone. It causes the vertical air currents within the storm to tilt, so that updrafts move up and over the downdrafts. The green arrows represent the updrafts created as warm, moist air is forced into the front of the storm. At the back end of the cloud, the updrafts swing around and become downdrafts (blue arrows). The leading edge of the downdrafts produces a gust front near the surface. As the gust front passes, the wind at the surface shifts and becomes strong, with gusts exceeding 100 kph (62 mph), temperatures drop, and the surface pressure rises. Warm moist air that rises over the gust front may form a roll cloud. These clouds are especially prevalent when a temperature inversion exists near the base of the thunderstorm.
Some severe thunderstorms can develop a strong vertical updraft, commonly known as a mesocyclone. Mesocyclones measure about 3 to 10 km (2 to 6 mi) across and extend from the storm's base to its top. They are also found in the storm's southwest quadrant. In some cases, mesocyclones can overshoot the top of the storm and form a cloud dome (Figures 8.10 and 8.11). About half of all mesocyclones initiate tornadoes. When a tornado occurs, the mesocyclone elongates vertically, constricts, and descends to the ground (Figure 8.12). Scientists speculate that mesocyclones form when strong horizontal upper-air winds interact with common updrafts. The shearing effect of this interaction forces the horizontal wind to flow upward, intensifying the updraft.
Thunderstorms and Tornadoes
A tornado is a vortex of rapidly moving air associated with some severe thunderstorms (Figure 8.13). Tornadoes that travel across lakes or oceans are calledwaterspouts. Winds within the tornado funnel may exceed 450 kph (280 mph). Such high-velocity winds cause most of the damage associated with these extreme weather events. Tornadoes can also cause damage through sudden reductions in air pressure. Air pressure around the tornado center can be as low as 800 mb (average sea level pressure is 1014 mb). Many human-made structures collapse outward when subject to pressure drops of this magnitude. The destructive path of a tornado is usually about 500 m (1600 ft) wide and usually no more than 25 km (16 mi) long. However, a spring tornado on May 26, 1917, traveled 471 km (293 mi) across Illinois and Indiana, lasting well over 7 hours.
About 69% of all tornadoes have wind speeds between 65 and 181 kph. These events are classified according to theFujita Tornado Intensity Scaleas being either F0 or F1 (Table 8.1). Damage from these tornadoes ranges from broken windows and downed tree branches to shingles blowing off roofs and cars being pushed off roads. Weak tornadoes have a path about 1.5 km (1 mi) long and 100 m (330 ft) wide, generally lasting for only 1 to 3 minutes. According to the Fujita scale, strong tornadoes (F2 and F3) can have wind speeds between 182 and 332 kph (113 to 206 mph). These weather events cause considerable damage and occur about 29% of the time. Strong tornadoes can have a course up to 100 km (62 mi) long and 500 m (1640 ft) wide, lasting for more than 2 hours. Tornadoes with a F4 or F5 category are relatively uncommon. These events have wind speeds between 333 and 513 kph (207 and 318 mph) and are very destructive and violent. F4 tornadoes occur only about 2% of the time, while F5 tornadoes are even more rare, with a chance of less than 1 in 1000 of happening.
Tornadoes occur in many parts of the world. Some notable hotspots include South Africa, Australia, Europe, New Zealand, northern India, Canada, Argentina, Uruguay, and the United States (Figure 8.14). Of these locations, the United States has specific regions within its borders that have extremely high event rates per year. In the United States, the highest number of tornadoes occurs in the southern plains, south of Lake Michigan, and west-central Florida (see Figure 8.15). This region of the United States is known as Tornado Alley.
Tornado occurrences exhibit interesting temporal characteristics. In the United States, most tornadoes occur in April, May, June, and July (Figure 8.16). During these months, we get the conditions necessary for the formation of severe thunderstorms. Tornadoes also form at particular times of day. Most tornadoes form in the afternoon to early evening (Figure 8.16). During these times, the heating of the Earth's surface is at its greatest. Intense heating enhances updrafts in severe thunderstorms. It is these updrafts that can lead to the development of a tornado.
About 40,000 tornadoes have occurred in the United States between 1950 and 1999. Data from 1950 to 2017 indicate that the frequency of tornadoes in the United States has increased substantially (Figure 8.17). But, part of this trend may be due to increased population densities. With higher population densities, the chance that these rare weather events will encounter people and be reported increases. Two other factors that could be responsible for the perceived increase in tornado numbers are satellite imaging and weather radar. These technologies allow us to quickly pinpoint thunderstorms that may generate tornadoes.
Over the last 50 years, total damage from tornadoes has been estimated to be about 25 billion US dollars. Tornadoes also take a heavy toll on human lives. Table 8.2 describes the ten deadliest tornado events in the United States. Weather forecasting technology has played an essential role in reducing the number of lives lost. In the 1930s, before the advent of severe weather forecasting, 1539 people were killed by tornadoes. From 1990 to 1999, only 564 individuals perished. This reduction is even more astonishing when you consider that the United States' population doubled from 1935 to 1995.
Oklahoma, May 3rd, 1999
Tornadoes can cause considerable damage to natural and human-made structures on the Earth's surface. Often, they also cause the injury and death of people. One event that set a new monetary record for destruction occurred in Oklahoma on May 3rd, 1999 (Figure 8.18). The devastation from this meteorological event began at 4:45 in the afternoon and lasted about 6 hours. During this period, about 70 tornadoes were spawned along a 240 km (150 mi) long swath that began in southwest Oklahoma.
Oklahoma receives more tornadoes per square kilometer than any other region found on our planet. This region of the United States also receives most of these severe events in May when warm, moist air from the Gulf of Mexico interacts with cold fronts descending from the northwest. On the morning of May 3rd, 1999, forecasters at the National Oceanic and Atmospheric Administration's (NOAA) Storm Prediction Center predicted only a slight risk for severe weather across parts of Oklahoma, Texas, and Kansas. However, by the afternoon, tornado generation conditions had significantly improved. Clear skies provided the solar radiation needed to raise surface temperatures and enhance the convective development of severe thunderstorms. A kink in the jet stream, known as a shortwave, strengthened the upper-air winds traveling from the east. Strong upper-level winds enhance the vertical mesocyclonic circulation within developing thunderstorms. This information was added to the high-resolution computer forecast model at the Storm Prediction Center. At 3:49 pm, the Storm Prediction Center updated the forecast and issued a tornado watch. Less than an hour later, the damage began.
The most significant damage on May 3rd occurred when the tornado funnels cut through Oklahoma City (Figure 8.18). The damage to the urban area stretched over 60 km (37 mi) and was at times more than one km (0.62 mi) wide. In some places, winds from the funnel were traveling about 420 to 510 kph (261 to 317 mph)! More than 2500 buildings were destroyed, and another 7500 were damaged. Total damage to structures and other property was estimated at 1.2 billion US dollars. The toll on human life for the entire state was 40 individuals. This number certainly would have been much higher if radio and television warning systems had not existed.

FIGURE 8.2 Whenever a parcel of air moves vertically in the atmosphere, it experiences internal temperature changes related to volumetric expansion or contraction. If the air is unsaturated (or dry), the rate of this temperature change is a constant 10°C for every 1000 meters of altitude change. This atmospheric process is called the dry adiabatic rate (A). Volumetric expansion and subsequent cooling occur when the air parcel rises. If the parcel descends, contraction and heating take place. If saturation occurs in the air parcel, the rate of temperature change with increasing altitude falls below 1°C per 100 meters. This atmospheric process is called the wet adiabatic rate (B). The wet adiabatic rate varies from about 5°C per 1000 meters for air with a high moisture content to 9°C per 1000 meters for air with a low moisture content. The conversion of water vapor to liquid releases latent heat, partially warming the air parcel. The amount of heat added to the parcel depends on the amount of water converted from gas to liquid. In diagramB,the air parcel drops in temperature at the dry adiabatic rate until it reaches the lifting condensation level (altitude of 2000 meters). At this altitude, the air reaches its dew point, condensation occurs, and latent heat is released into the air parcel. As the air parcel continues to rise, it now cools at the wet adiabatic rate, which is less than the dry adiabatic rate. Image Copyright: Michael Pidwirny.

FIGURE 8.3 This very large 18 cm (7 in) hailstone fell in Aurora, Nebraska, on June 2, 2003. Image Source: NOAA - National Weather Service.

FIGURE 8.4 Lightning from a thunderstorm as seen at night above Kelowna, British Columbia, Canada. Image Copyright: Michael Pidwirny.

FIGURE 8.5 Average annual number of thunderstorm days across the United States. Image Source: NOAA.

FIGURE 5 The three stages in the development of air mass thunderstorms. Image Copyright: Michael Pidwirny.

FIGURE 8.7 A developing thunderstorm cloud at the cumulus stage. Image Copyright: Michael Pidwirny.

FIGURE 8.8 Mature thunderstorm cloud with a typical anvil-shaped cloud. Image Copyright: Michael Pidwirny.

FIGURE 8.9 Average annual severe thunderstorm watch day frequency in the United States by county. The legend scale is the number of days. Data is from the period 1999 to 2008. Data Source: NOAA. Image Source: Wikimedia Commons.

FIGURE 8.10 Model of the major features and circulation patterns associated with a severe thunderstorm. This model shows the relative positions of hail and heavy rain behind the gust front. The gust front represents the leading edge of the storm's cold downdrafts. The roll cloud develops at the storm's base and above the gust front, where incoming moist warm air meets cold downdrafts. Mammatus clouds usually form beneath the extended anvil portion of the thunderstorm cell. Seeing these clouds provides some warning of the approaching severe weather associated with the thunderstorm. Image Copyright: Michael Pidwirny.

FIGURE 8.11 Some major features associated with a severe thunderstorm. Image Source: NOAA.

FIGURE 8.12 Internal spiral airflow of a severe thunderstorm mesocyclone and its association with a tornado. Image Source: Wikipedia, artwork by Vanessa Ezekowitz. This image is licensed under the Creative Commons Attribution-Share Alike 3.0 Unported license.

FIGURE 8.13 Category F5 tornado photographed from the southeast as it neared Elie, Manitoba on Friday, June 22, 2007. Image Source: Wikipedia, photo by Justin Hobson. This image is licensed under the Creative Commons Attribution-Share Alike 3.0 Unported license.

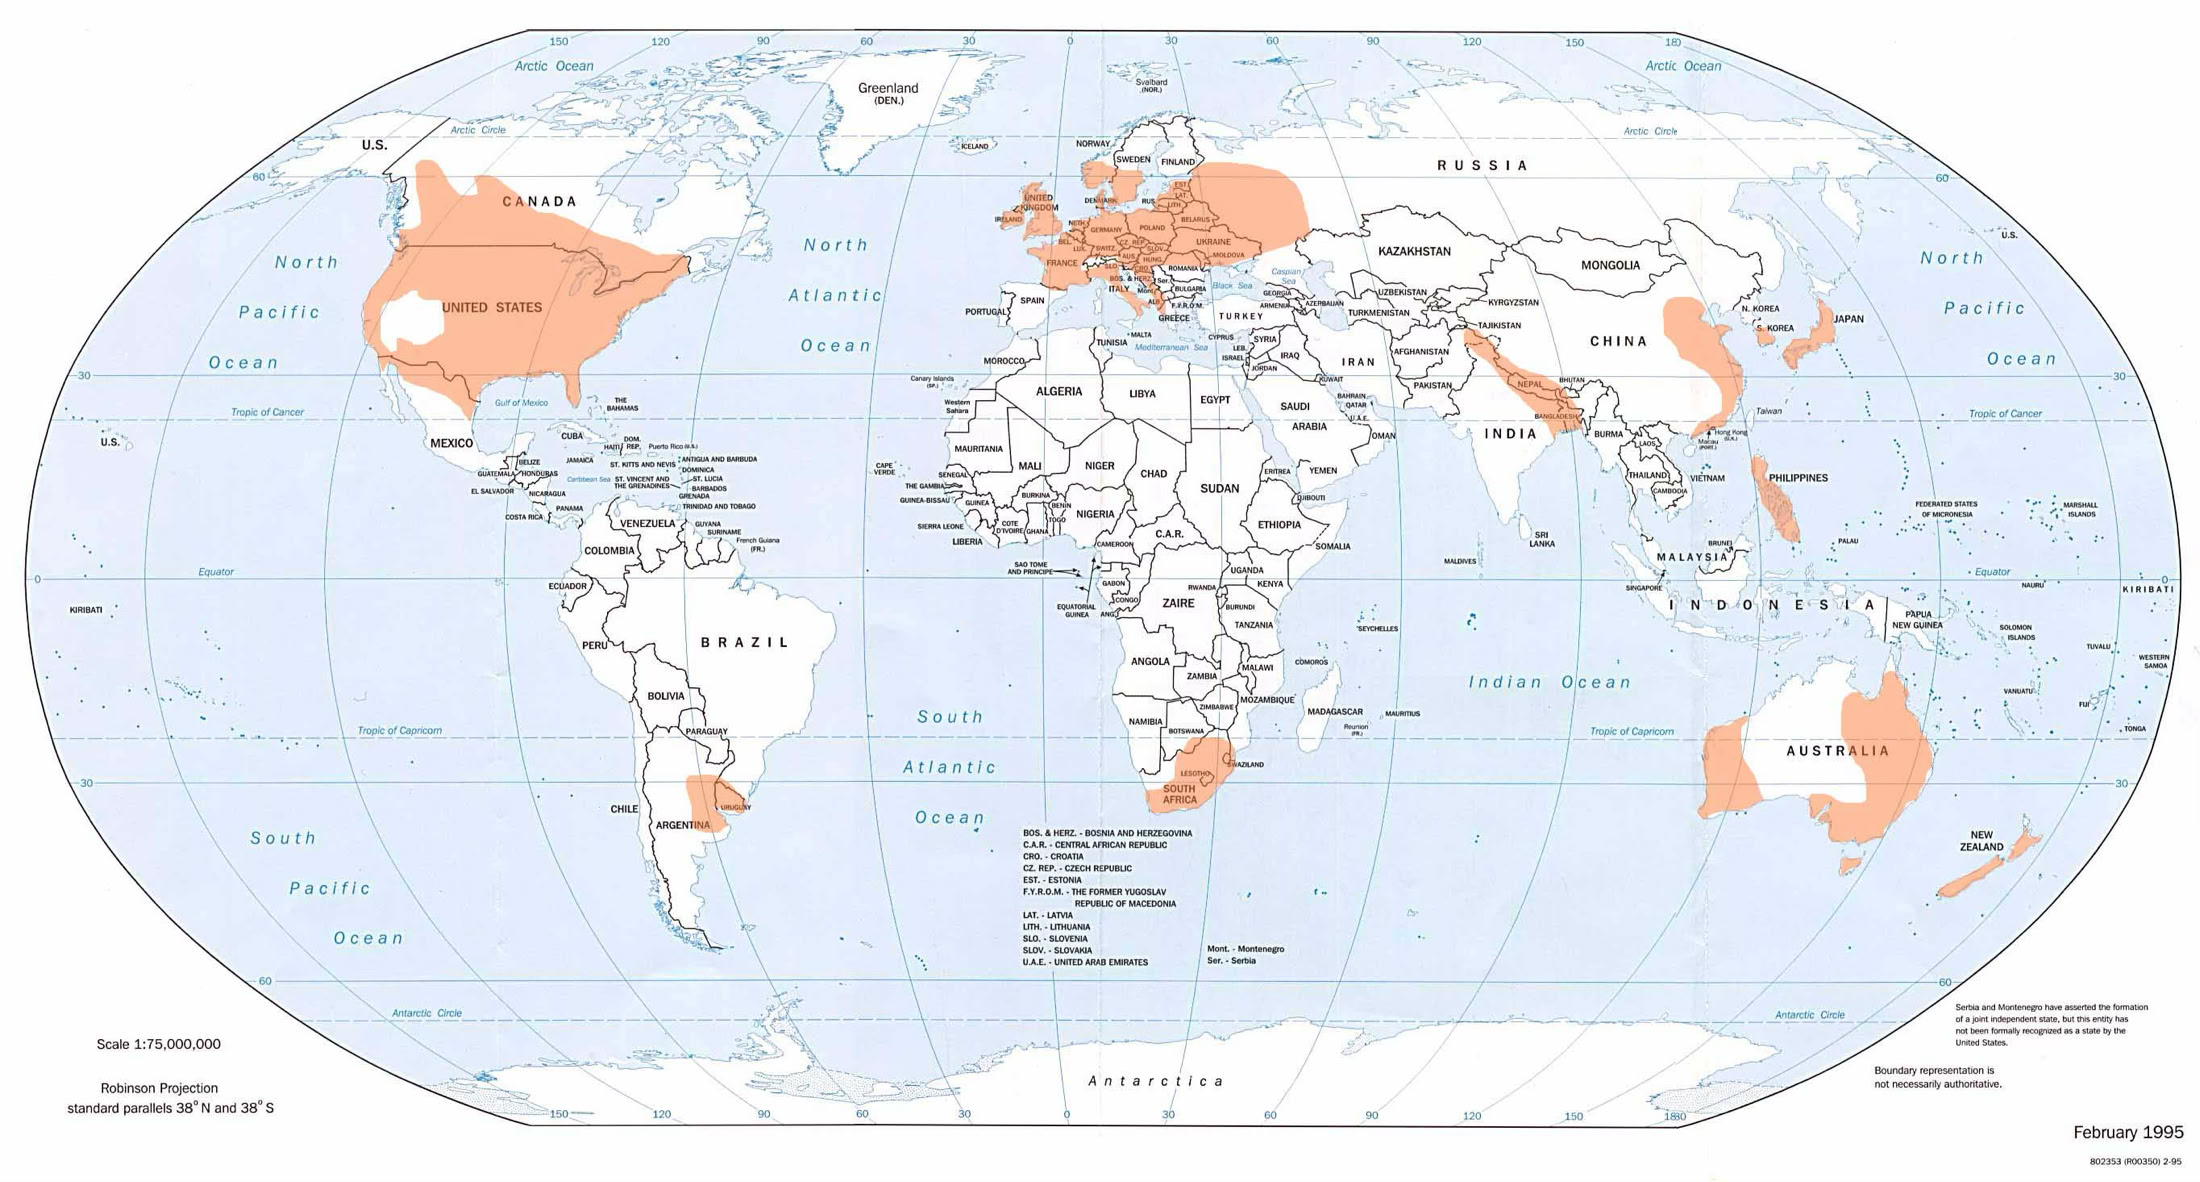
FIGURE 8.14 Map showing the typical locations where tornadoes form on our planet. Image Source: WIkimedia Commons, Map by NOAA.

FIGURE 8.15 Average annual distribution of reported tornadoes in the United States between 1950 and 1995. Image Source: Wikimedia Commons.


FIGURE 8.16 Average number of tornadoes per month (top - 1991 to 2020) and per hour of the day (bottom - 1950 to 2020) in the United States. Image Source: NOAA - National Centers for Environmental Information.

FIGURE 8.17 Average number of tornadoes per year in the United States for the period 1950 to 2017. Image Source: NOAA - National Centers for Environmental Information.


FIGURE 8.18 Tornado paths in and around Oklahoma City on May 3, 1999. Different colors identify individual tornado tracks. Fujita Scale values give a relative measure of tornado intensity. Note that the largest tornado track that cuts through the city's center has intensity values recorded along its entire path. Image Source: NOAA - The National Severe Storms Laboratory.