We can understand how global circulation works by developing two visual models of the processes that produce this system. The first model will be founded on the following simplifying assumptions:
- The Earth is not rotating on its axis in space.
- The Earth's surface is composed of the same material throughout.
- The global reception of solar insolation and the loss of longwave radiation create a temperature gradient with hotter air at the equator and colder air at the poles.
Based on these assumptions, air circulation on the Earth should approximate the patterns shown in Figure 7.30. In this illustration, each hemisphere contains one three-dimensional circulation cell with surface low pressure systems (L) dominating the equator and high pressure systems (H) at the poles.
As described in the diagram above, surface airflow is from the poles to the equator. When the air reaches the equator, the processes of convection and convergence act together to cause vertical uplift. The air over the equator continues to rise until it reaches the top of the troposphere. At the top of the troposphere, the air begins to flow horizontally toward the poles again. At the poles, the air in the upper atmosphere descends to Earth's surface, completing the flow cycle.
Three-Cell Model of Global Circulation
If we eliminate the first assumption, the flow pattern described in the simple model just described would change, and the circulation of the atmosphere would more closely resemble the actual global patterns observed on Earth. Planetary rotation would cause the development of three circulation cells in each hemisphere rather than one single circulation cell (Figure 7.31). These three circulation cells are theHadley Cell, theFerrel Cell, and thePolar Cell.
In the new model, the equator remains the warmest location on Earth. This area of greater heat acts as a zone of thermal lows known as the Intertropical Convergence Zone (ITCZ). The Intertropical Convergence Zone draws in surface air from the subtropics. When this subtropical air reaches the equator, it rises into the upper atmosphere because of convergence and convection, producing a surface band of low pressure (L). The rising air at the Intertropical Convergence Zone reaches a maximum altitude of about 16 km (9.9 mi). This height represents the top of the troposphere. The rising air changes direction at the top of the troposphere and begins traveling horizontally towards the North and South Poles. The Coriolis effect deflects this moving air in the upper atmosphere, and at about 30° of latitude, the air begins to flow zonally from west to east. This zonal flow is known as the Subtropical Jet Stream. The development of this zonal flow also causes the accumulation of air in the upper atmosphere, as it is no longer flowing meridionally. To compensate for this accumulation, some of the air in the upper atmosphere sinks back to the surface, creating the Subtropical High Pressure Zone (H). From this zone, the surface air travels in two directions. A portion of the air moves back toward the equator, completing the circulation system known as the Hadley Cell. This moving air is also deflected by the Coriolis effect to create the Northeast Trades (right deflection) and Southeast Trades (left deflection). The surface air moving towards the poles from the subtropical high zone is also deflected by the Coriolis effect, producing the Westerlies. Upper air winds generally blow toward the poles between 30 and 60° North and South latitudes. Once again, the Coriolis effect deflects this wind, causing it to flow in a west-to-east direction at roughly 60° North and South. This zone of high-speed winds in the upper atmosphere is called the Polar Jet Stream. The Westerlies collide with cold air traveling from the poles at 60° North and South latitudes on Earth's surface. This collision results in frontal uplift and the creation of the Polar Front and Subpolar Lows (L), or storms known as mid-latitude cyclones. A small portion of this lifted air is sent back into the Ferrel Cell after it reaches the top of the troposphere. Most of this lifted air is directed to the poles, creating the Polar Vortex. The descending very cold air in the Polar Vortex produces the Polar High (H) at the Earth's surface and surface winds known as the Polar Easterlies that travel to the Subpolar Lows.
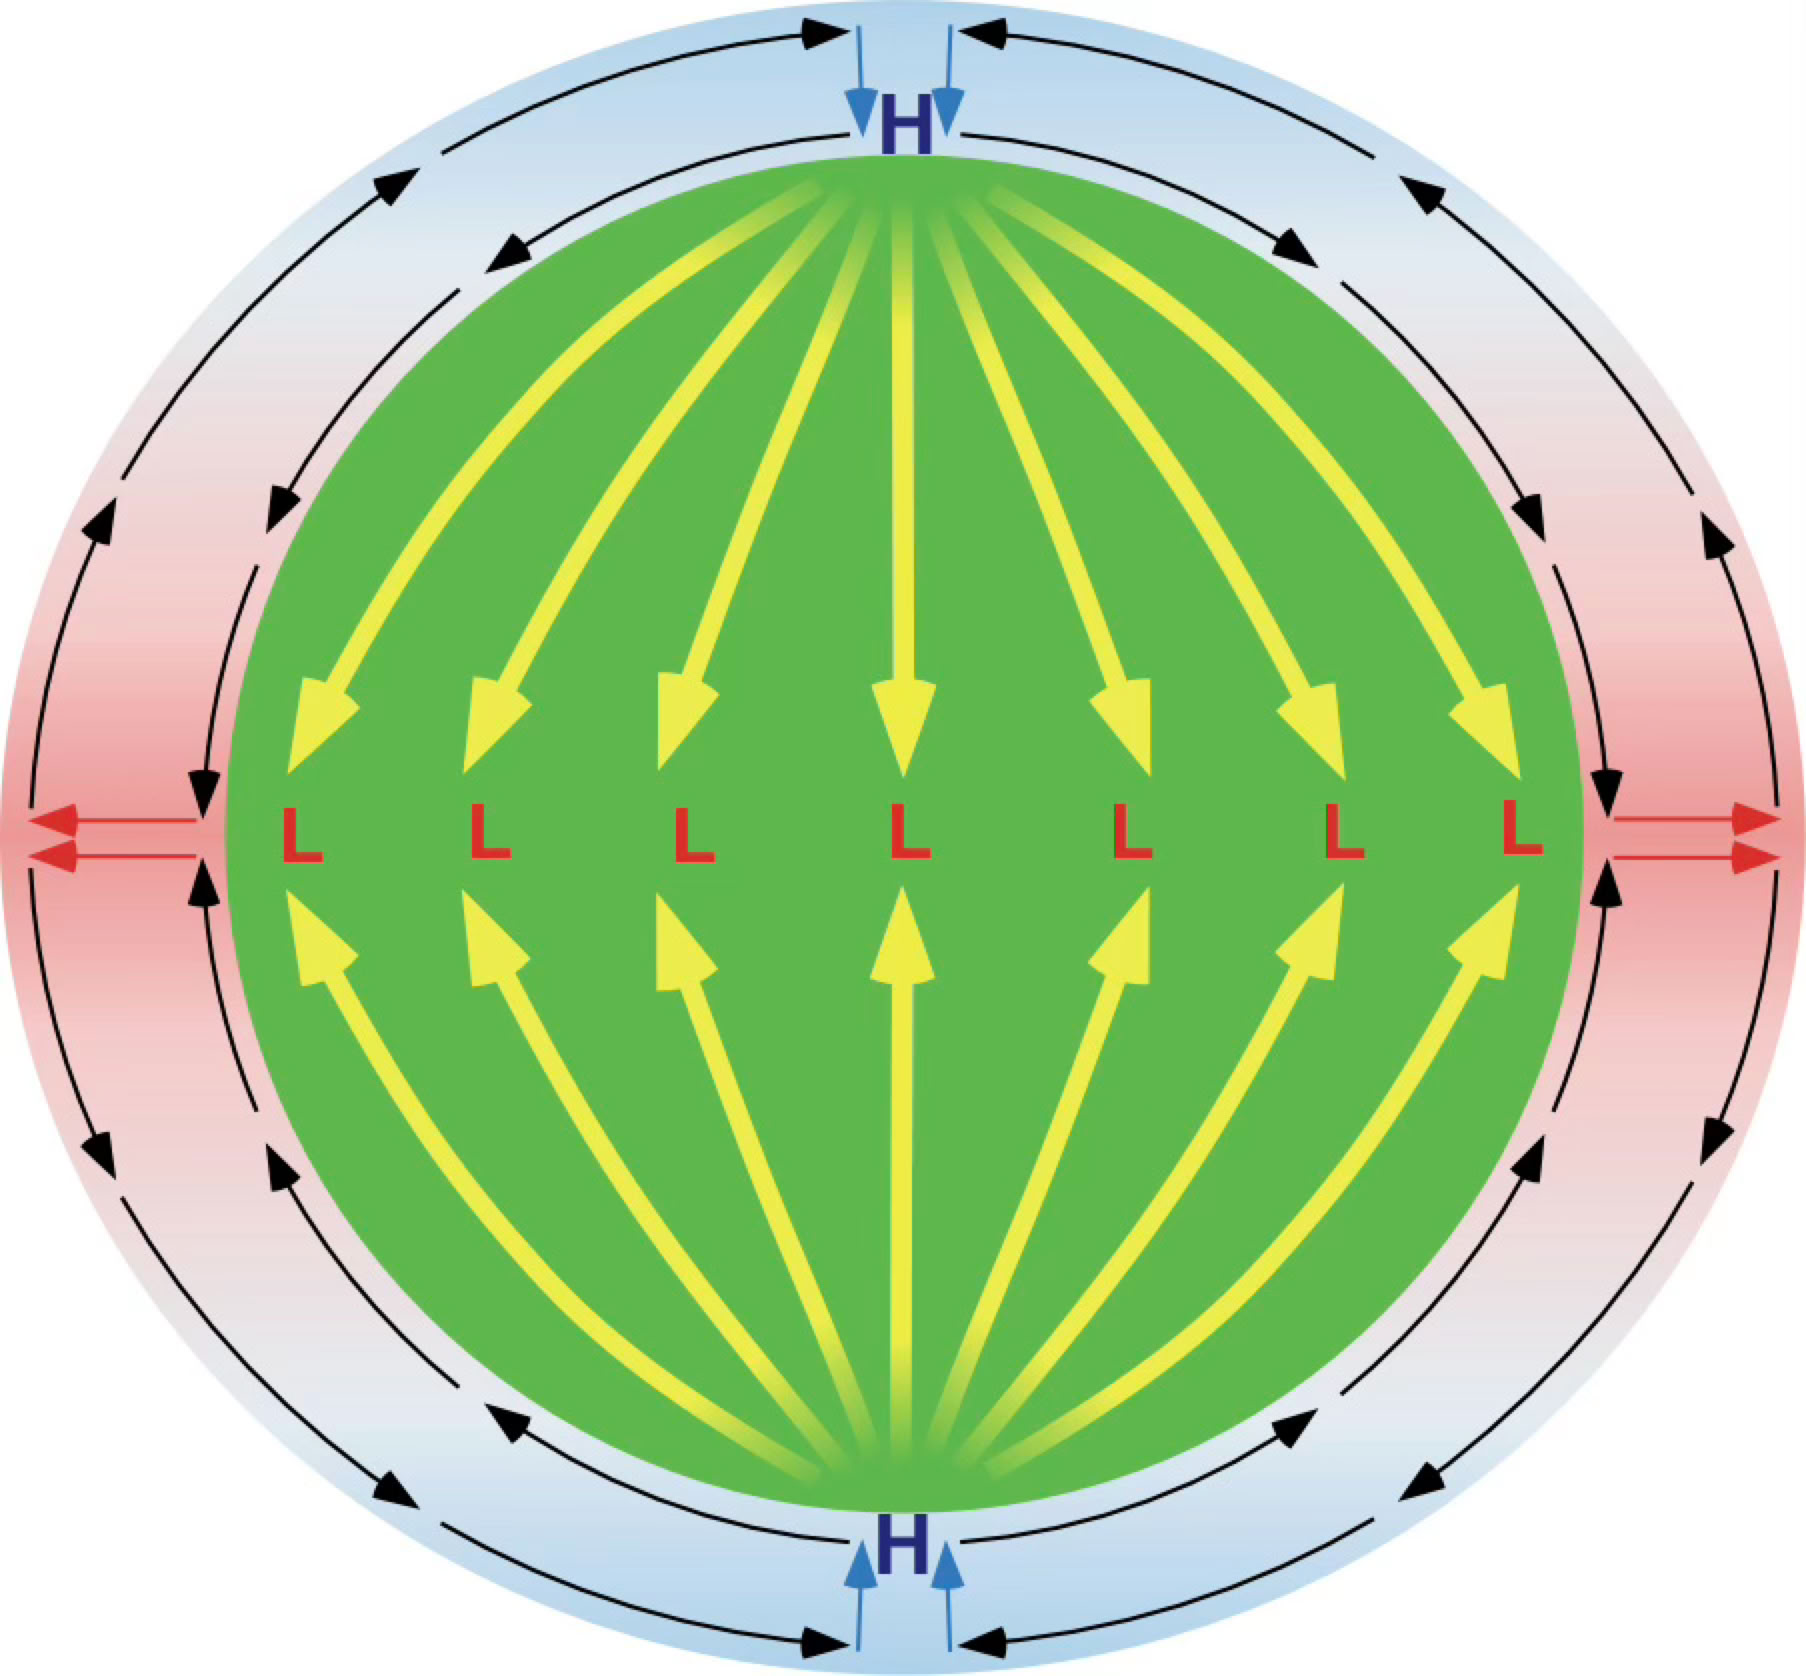
FIGURE 7.30 Simplified one-cell global air circulation patterns. Image Copyright: Michael Pidwirny.
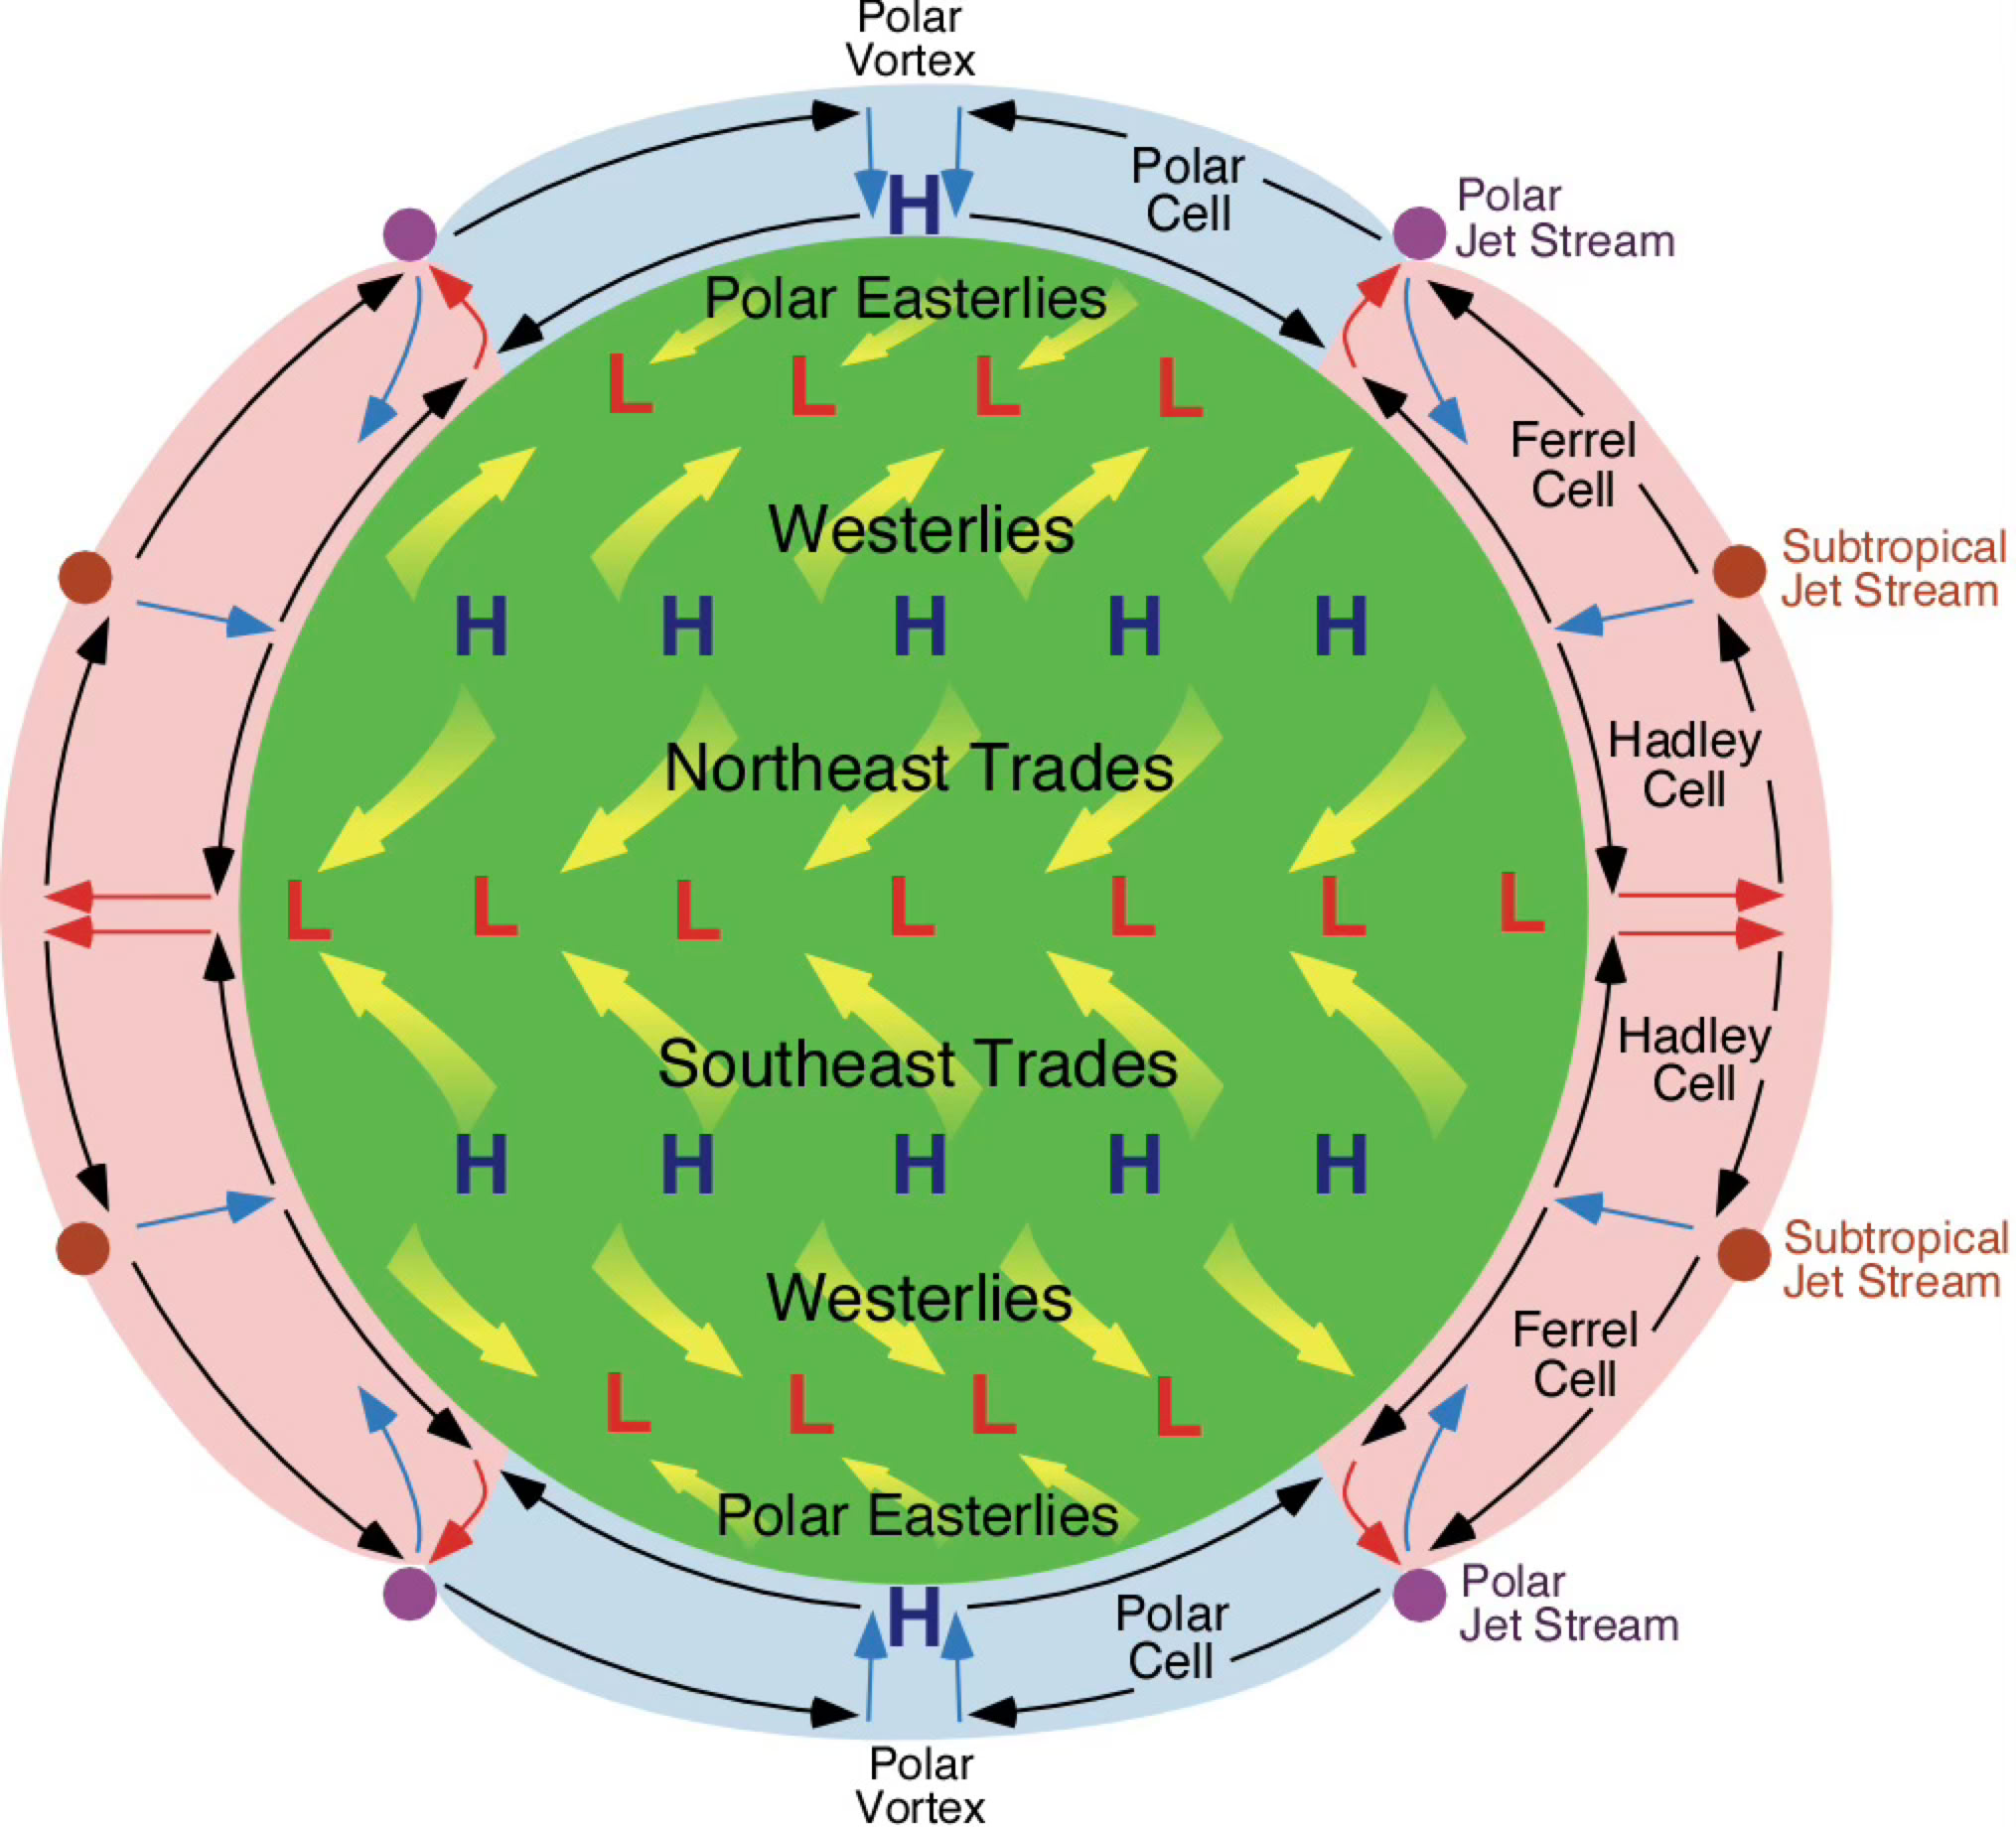
FIGURE 7.31 Idealized three-cell global circulation model. Image Copyright: Michael Pidwirny.