The shape of the Earth's surface can be described as an ellipsoid. An ellipsoid is a three-dimensional shape that departs slightly from a purely spherical form (Figure 2.13). The Earth takes this form because rotation causes the region near the equator to bulge outward. The angular motion caused by the Earth spinning on its axis also makes the polar regions somewhat flattened.
Representing the true nature of the Earth's surface on a map is plagued by a single major problem. The Earth's surface exists in three-dimensional space, while maps exist in two-dimensional space. To overcome this problem, cartographers have developed many standardized transformation processes for creating two-dimensional maps. These transformation processes are all based on simply projecting the three-dimensional surface of the Earth onto a two-dimensional surface that has either been kept flat or rolled into a cone or cylinder. All of these transformation processes create some type of distortion artifact. The nature of this distortion is related to how the transformation process modifies specific geographic properties of the real world. Some geographic properties affected by projection distortion include distance, area, the straight-line direction between points on the Earth, and the bearing of cardinal points from locations on our planet.
Cylindrical Map Projections
Projecting the Earth’s surface onto a cylinder creates a cylindrical map projection (Figure 2.14). The Flemish cartographer Gérardus Mercator first employed this map-creation technique in 1569. Mercator’s cylindrical map projection system quickly became the standard for maritime mapping in the 16th, 17th, and 18th centuries (Figure 2.15). The U.S. National Ocean Service has been using the Mercator map projection system to create nautical charts for over 90 years.
On a Mercator projection, the north-south scale increases from the equator at the same rate as the east-west scale (Figure 2.16). Because of this geometric feature, lines on Mercator maps have true direction, making them extremely useful for navigation. This type of line is known as a rhumb line. No other map projection accurately represents the angles of drawn lines. However, this line may not denote the shortest distance between its two endpoints. Distance is only true along the equator, and distance distortion becomes more exaggerated as you move away toward the poles. Mercator maps also suffer from severe area distortion. This deformation causes areas to become disproportionately large as one moves to the poles. For example, Greenland is overstated by about 700% compared to areas near the equator.
Conic Map Projections
In the conic map projection, the surface of the Earth is projected onto a cone (Figure 2.17). The cone can be placed on the globe so that its edge runs parallel to a line of latitude. Another variation of the conic projection positions the cone so that its surface intersects the Earth at two parallels. This latter case is more commonly used because it increases the map area depicted with reasonable accuracy. Conic projections are best suited for maps of mid-latitude regions. The United States, Europe, and Asia are frequently mapped with this system. Conic map projections are also standard in atlases.
The Albers equal area map projection is a popular conic projection developed by H.C. Albers in 1805 (Figure 2.18). This projection system mathematically projects the cone so that its surface intersects the Earth at two standard parallels. On this projection, all areas on the map are proportional to the same areas on the globe. Directions are only moderately accurate where the cone cuts the Earth’s surface. Distance and scale are correct just along the standard parallels.
Planar Map Projections
Planar or azimuthal map projections project the Earth onto a flat surface or plane (Figure 2.19). The Earth’s surface touches this plane at only one point or tangent. The alternative name for this projection, the azimuthal projection, is derived from one of its essential properties. Lines of compass bearing or azimuth are true only from the center of the map. The ancient Greeks constructed the first planar maps around 600 BCE. Modern versions of this projection are often used to illustrate the polar regions of our planet. However, these maps are plagued by area and shape distortions that increase toward the tangent point. Some navigators use a geometrically altered form of this map system called a gnomonic projection (Figure 2.20). The gnomonic map projection allows one to determine the shortest path (not distance) between two points and is therefore suited for some forms of navigation.
Other Map Projections
Mathematical techniques have been developed to project the Earth’s surface on a variety of two-dimensional shapes. Many of these projections have been created to compensate for a distortion artifact. Figure 2.21 displays the Robinson map projection, which projects the globe onto a somewhat oval shape. This projection was developed by Arthur H. Robinson in 1963 to show the entire Earth with less area distortion.


FIGURE 2.14 Cylindrical map projections are drawn as if the Earth’s surface were projected onto a cylinder. Note how this projection distorts the Earth’s lines of longitude and latitude. On the true spherical surface of the Earth, the lines of longitude or meridians converge on each other as one goes from the equator to the poles. However, the cylindrical projection portrays the meridians as being equally spaced apart from the equator to the poles. Lines of latitude retain the property of being parallel to each other, but are distorted with distance. The distance between consecutive lines of latitude becomes progressively more significant as one moves from the equator to the poles. Image Source: United States Geological Survey.


FIGURE 2.20 Map of the region around the North Pole. This map was created with a gnomonic map projection. In this projection, lines of longitude appear as straight lines radiating from the North Pole. Lines of latitude appear as circles. Scale distortion increases rapidly as you move away from the projection's central point (the North Pole). Navigators can use this map to find the shortest path between two points. Image Copyright: Michael Pidwirny.
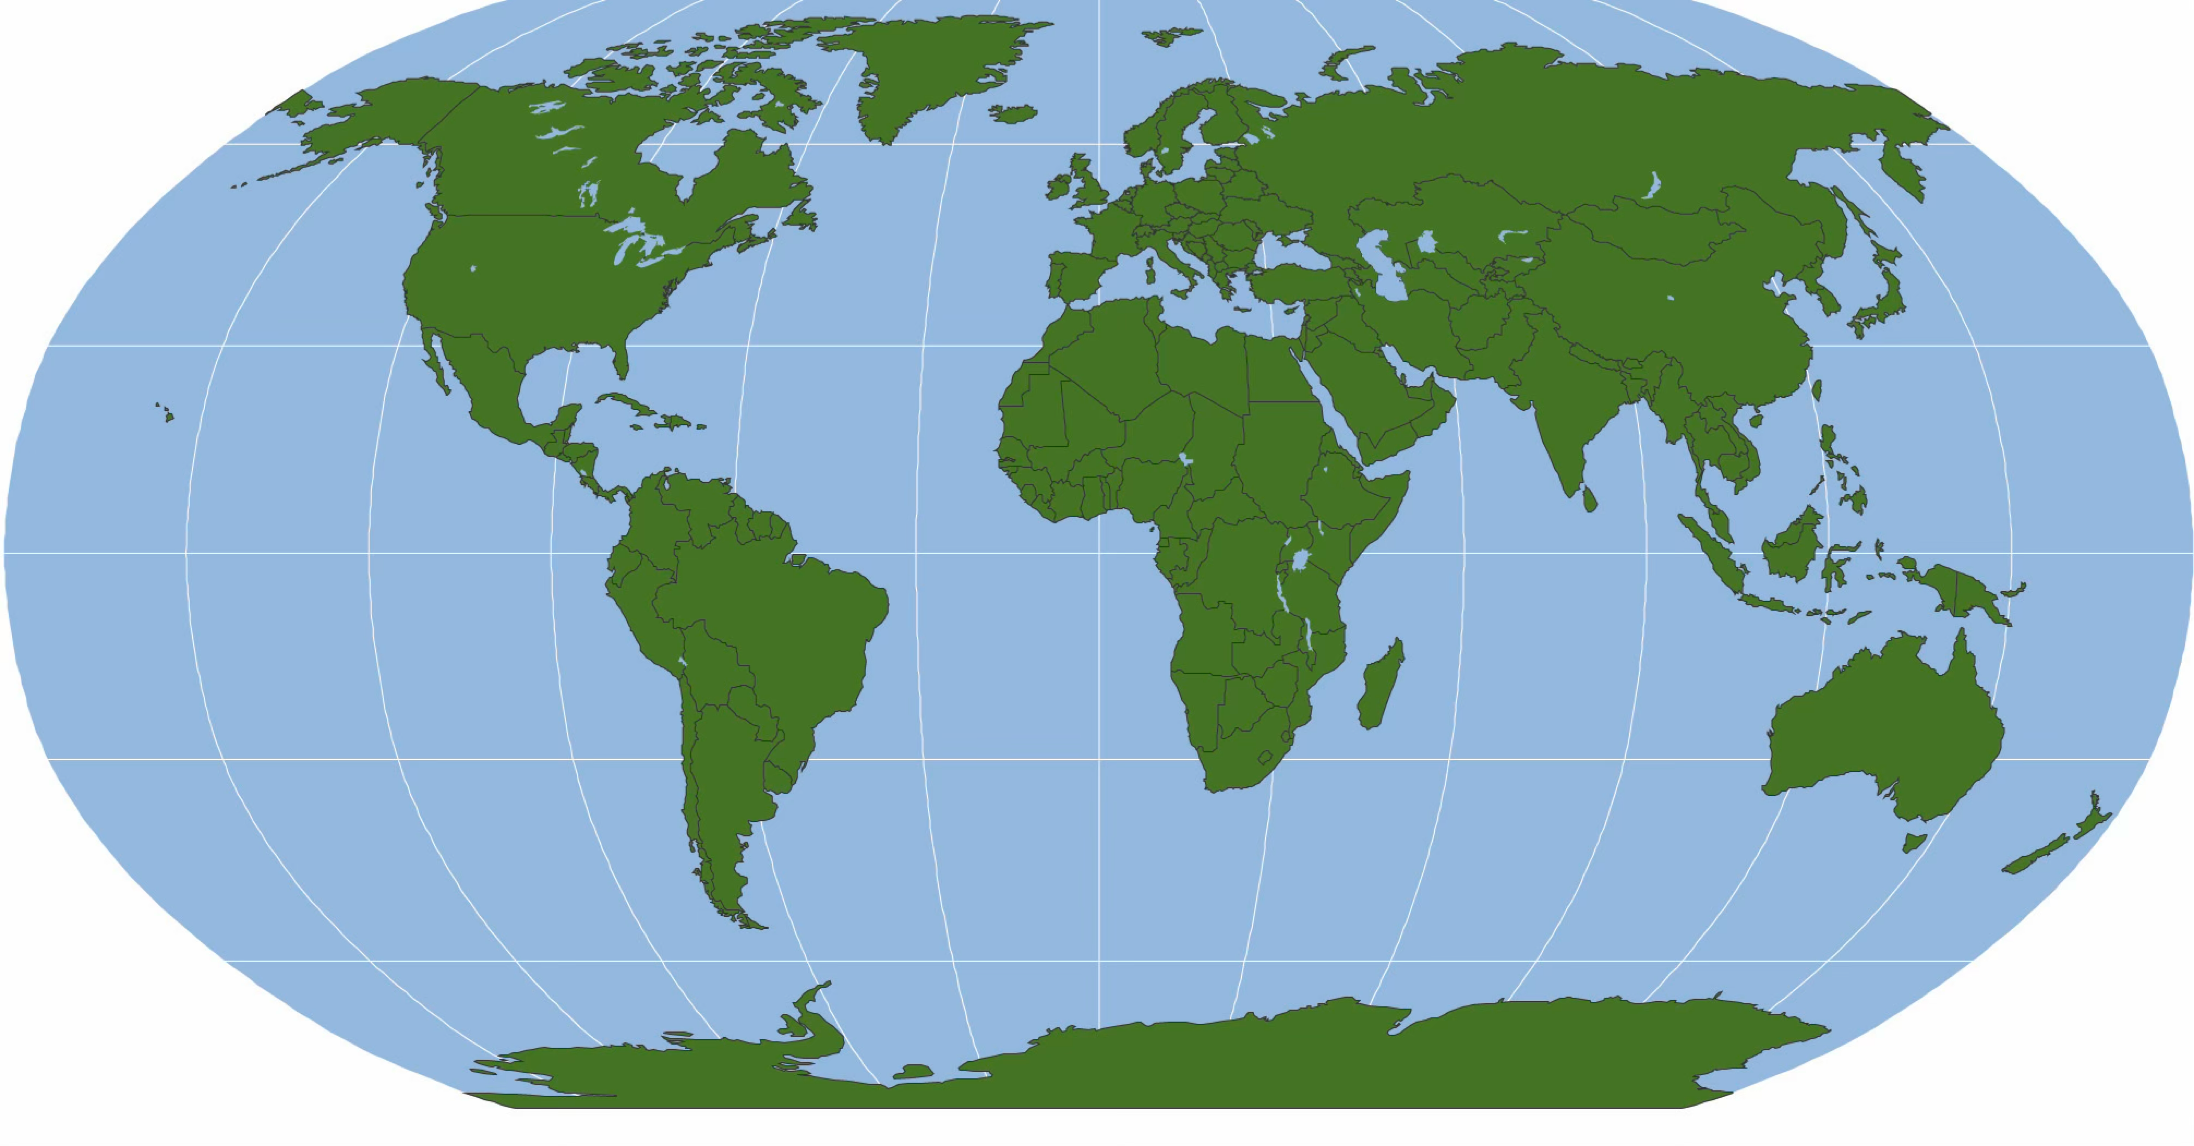
FIGURE 2.17 Conic map projections are drawn as if the Earth’s surface were projected onto a cone. The cone touches the Earth’s surface in this illustration at one standard parallel. More complex versions can intersect the globe at two standard parallels. This projection is best suited for mapping regions in the middle latitudes. Image Copyright: Michael Pidwirny.
FIGURE 2.18 Map of North America created with the Albers equal area map projection system. This map uses two standard parallels in the projection process: 20 and 60° North. Distances are true only along these lines of latitude. Areas are proportional to the same areas on the Earth’s surface. Directions are reasonably accurate in the regions around the standard parallels. Image Copyright: Michael Pidwirny.
FIGURE 2.19 Planar map projections are drawn as if the Earth’s surface were projected onto a flat surface or plane. In this illustration, the plane touches the Earth’s surface at only one point of the Earth’s surface – the North Pole. More complex versions of this projection can be created by varying the geometry of how the Earth’s surface is projected onto the plane. Image Copyright: Michael Pidwirny.
FIGURE 2.13 The Earth is not perfectly spherical but has an ellipsoid shape. The dashed circle shows a perfect circle for reference. This reference indicates that the Earth bulges at the equator and is compressed at the poles. Image Copyright: Michael Pidwirny.
FIGURE 2.15 This 1569 map was constructed using the Mercator map projection system and illustrates the Americas, Africa, Europe, and Asia. This projection was extremely valuable to sailors because it permitted accurate directional navigation. Image Source: Wikimedia Commons.
FIGURE 2.16 World map based on the Mercator map projection system. Image Copyright: Michael Pidwirny.
FIGURE 2.21 The Robinson map projection is commonly used in maps that require a somewhat accurate representation of area. This map projection was originally developed for atlas producer Rand McNally in the early 1960s. Image Copyright: Michael Pidwirny.