Annual Surface Air Temperatures
Figure 6.24 describes global mean annual near-surface air temperature data averaged from 1951-2000. The temperature distribution patterns in this figure are strongly controlled by latitude’s influence on solar radiation inputs (Chapter 5, Figure 5.26, see section Surface Albedo and Insolation). The highest mean annual surface air temperatures over both land and ocean are generally found around the equator, where yearly accumulations of net radiation are the greatest (Chapter 5, Figure 5.32, see section Global Radiation Transfers). Temperature gradually drops poleward from this zone until we reach global minima over Greenland and Antarctica. The almost latitudinal banding of surface air temperature is partially disrupted by the fact that water bodies respond differently to heating and cooling than land surfaces. Figure 6.24 also shows the effect of altitude (e.g., the Himalayas and Andes Mountains) and albedo (Greenland and Antarctica) on surface air temperature. As discussed in this chapter, temperatures tend to drop with altitude because of greater loss of outgoing longwave radiation. Surfaces composed of snow and ice have a high albedo that limits the absorption of incoming shortwave radiation, which is required to generate heat energy.
January Surface Air Temperatures
Figure 6.25 illustrates the distribution of Earth's temperatures in January based on an average of 50 years of data. Observe that the spatial variations of temperature in this figure are also strongly influenced by changes in latitude. Once again, the horizontal banding of zones of similar temperature is somewhat disrupted because water heats up more slowly in the summer and cools down more slowly in the winter than terrestrial surfaces do. During January, land areas north of 30° latitude in the Northern Hemisphere generally have temperatures well below freezing. Notable Northern Hemisphere cold spots include central and northern Canada, Greenland, northeastern Russia, and the Tibetan Plateau. At the same latitude, temperatures over Northern Hemisphere ocean surfaces tend to be warmer than adjacent land surfaces because of the ocean's ability to store large quantities of heat energy.
In the Southern Hemisphere, temperatures over the major landmasses are generally greater than 20°C (68°F), with localized hotspots in Australia, the Kalahari Desert in southern Africa, tropical Africa, parts of northern Brazil, and the plains of Bolivia, Paraguay, and Argentina. The tropical oceans are often a bit warmer than land mass areas just south of the equator. At this latitude, land areas move a lot of received solar energy into the almost daily convective development of cumulus and cumulonimbus clouds. In the Southern Hemisphere mid-latitudes, oceans are often cooler than landmasses at similar latitudes. Terrestrial areas are warmer because land surfaces heat rapidly during the summer, when daily solar radiation is highest. Antarctica remains cold and below 0°C (32°F) due to the presence of permanent glacial ice, which reflects much of the solar radiation received back to space.
July Surface Air Temperatures
In July, the Northern Hemisphere is in summer because the North Pole is tilted towards the Sun, increasing the amount of solar radiation. Some obvious Northern Hemisphere hotspots include the southern United States, northern Mexico, northern Africa, the Middle East, northern India, Pakistan, southern Afghanistan, and Turkmenistan (Figure 6.26). Temperatures over Northern Hemisphere ocean surfaces tend to be cooler than those over adjacent landmasses because land heats up more quickly. Northern Hemisphere areas with cooler temperatures include Greenland, the Canadian Rocky Mountains, and the Tibetan Plateau. In these regions, most incoming solar radiation is reflected back into space by reflective ice and snow.
In the Southern Hemisphere, temperatures over the major land masses are generally cooler than ocean surfaces at the same latitude. Antarctica is bitterly cold because most of it has 24 hours of night and therefore receives no solar radiation. Also, note that Antarctica is much colder than the Arctic during its winter season (compare Figures 6.25 and 6.26). The Arctic surface is mainly ocean. During the summer (July), this surface can absorb considerable amounts of sunlight, which is then converted into heat. Significant amounts of this stored heat energy are carried over into the winter season. Antarctica's surface is composed primarily of highly reflective snow and ice. This surface absorbs only a fraction of the solar radiation falling on it during the summer. So it never really heats up, and the quantity of summer heat energy transferred into the winter season is minimal.
Seasonal Temperature Variations
Figure 6.27 describes the annual range in global surface temperatures averaged for the period 1959-1997. The patterns on this map illustrate that land and water have very different thermal characteristics. Near the equator, temperature ranges are very similar for the two surface types, varying by about 5°C (9°F). This observation can be explained by the fact that radiation input remains constant year-round in this region. Outside this area, the temperature range becomes much greater over landmasses due to the continental effect. Subpolar regions in the center of North America and Asia experience temperatures exceeding 40°C (72°F). In comparison, ocean surfaces at the same latitude experience an annual range of only 10° to 15°C (18° to 27°F) because the maritime effect moderates them.
Ocean Surface Temperatures
The Earth's surface consists of about 30% land and 70% ocean. Measuring surface air temperature on land is relatively simple, as weather stations are easy to set up and maintain. As a result, a network of over 15,000 land-based weather stations is currently operating, providing daily climatic measurements. Measuring surface air temperature over our planet's oceans is much more difficult. Part of this difficulty stems from the fact that we do not have permanent, stationary communities on the open-ocean surface. Yet we do have a large number of ships moving across the oceans at any given moment. The World Meteorological Organization (WMO) uses some of these ships as roving weather stations. About 7,000 ships take routine real-time measurements of ocean conditions and transmit them to weather data processing centers. As one might guess, reports from these ships are concentrated along the major shipping routes, mainly in the North Atlantic and North Pacific Oceans. Data collection in the Southern Hemisphere oceans is sparse.
Several nations have also created a network of remote automated weather stations mounted on permanently anchored buoys. In the United States, theNational Data Buoy Center(NDBC) manages the operation and maintenance of about 65weather station buoysin coastal and offshore waters from the western Atlantic to the Pacific Ocean around Hawaii and from the Bering Sea to the South Pacific. NDBC's weather station buoys come in four sizes: 3, 10, and 12 m (10, 33, and 39 ft) circular hulls and a 6 m (20 ft) boat-shaped hull. The hull type typically depends on the intended deployment location (Figure 6.28). Locations with frequent storms and large ocean swells require larger, boat-shaped hulls to reduce the risk of capsizing. NDBC's moored buoys measure barometric pressure, wind direction, wind speed, and air and sea temperature. The instrument used to measure surface air temperature is mounted on a tower between 4 and 10 m (13 and 33 ft) above the sea surface. Weather measurements from the buoys are transmitted to one of the National Oceanic and Atmospheric Administration's (NOAA) Geostationary Operational Environmental Satellites (GOES) every hour. From the satellite, the data are then transmitted to a weather data processing center in Virginia, USA.
Scientists also measure the ocean's surface temperature (Figure 6.29). Weather development in the lower atmosphere is often related to sea surface temperatures. For example, occasional variations in the tropical Pacific Ocean's sea surface temperature, known as La Niña and El Niño, can occur. These temperature variations have been linked to several changes in regional weather worldwide. Both ships and stationary buoys are used to collect sea surface temperature data. Yet, the value of these measurements is limited because significant portions of the Earth's ocean surface are not being monitored. Over the last two decades, scientists have used a variety of sensors aboard several space satellites to more effectively measure sea surface temperatures. Comparisons of satellite-derived sea surface temperature data with measurements from ships and remote weather station buoys have shown them to be highly accurate.
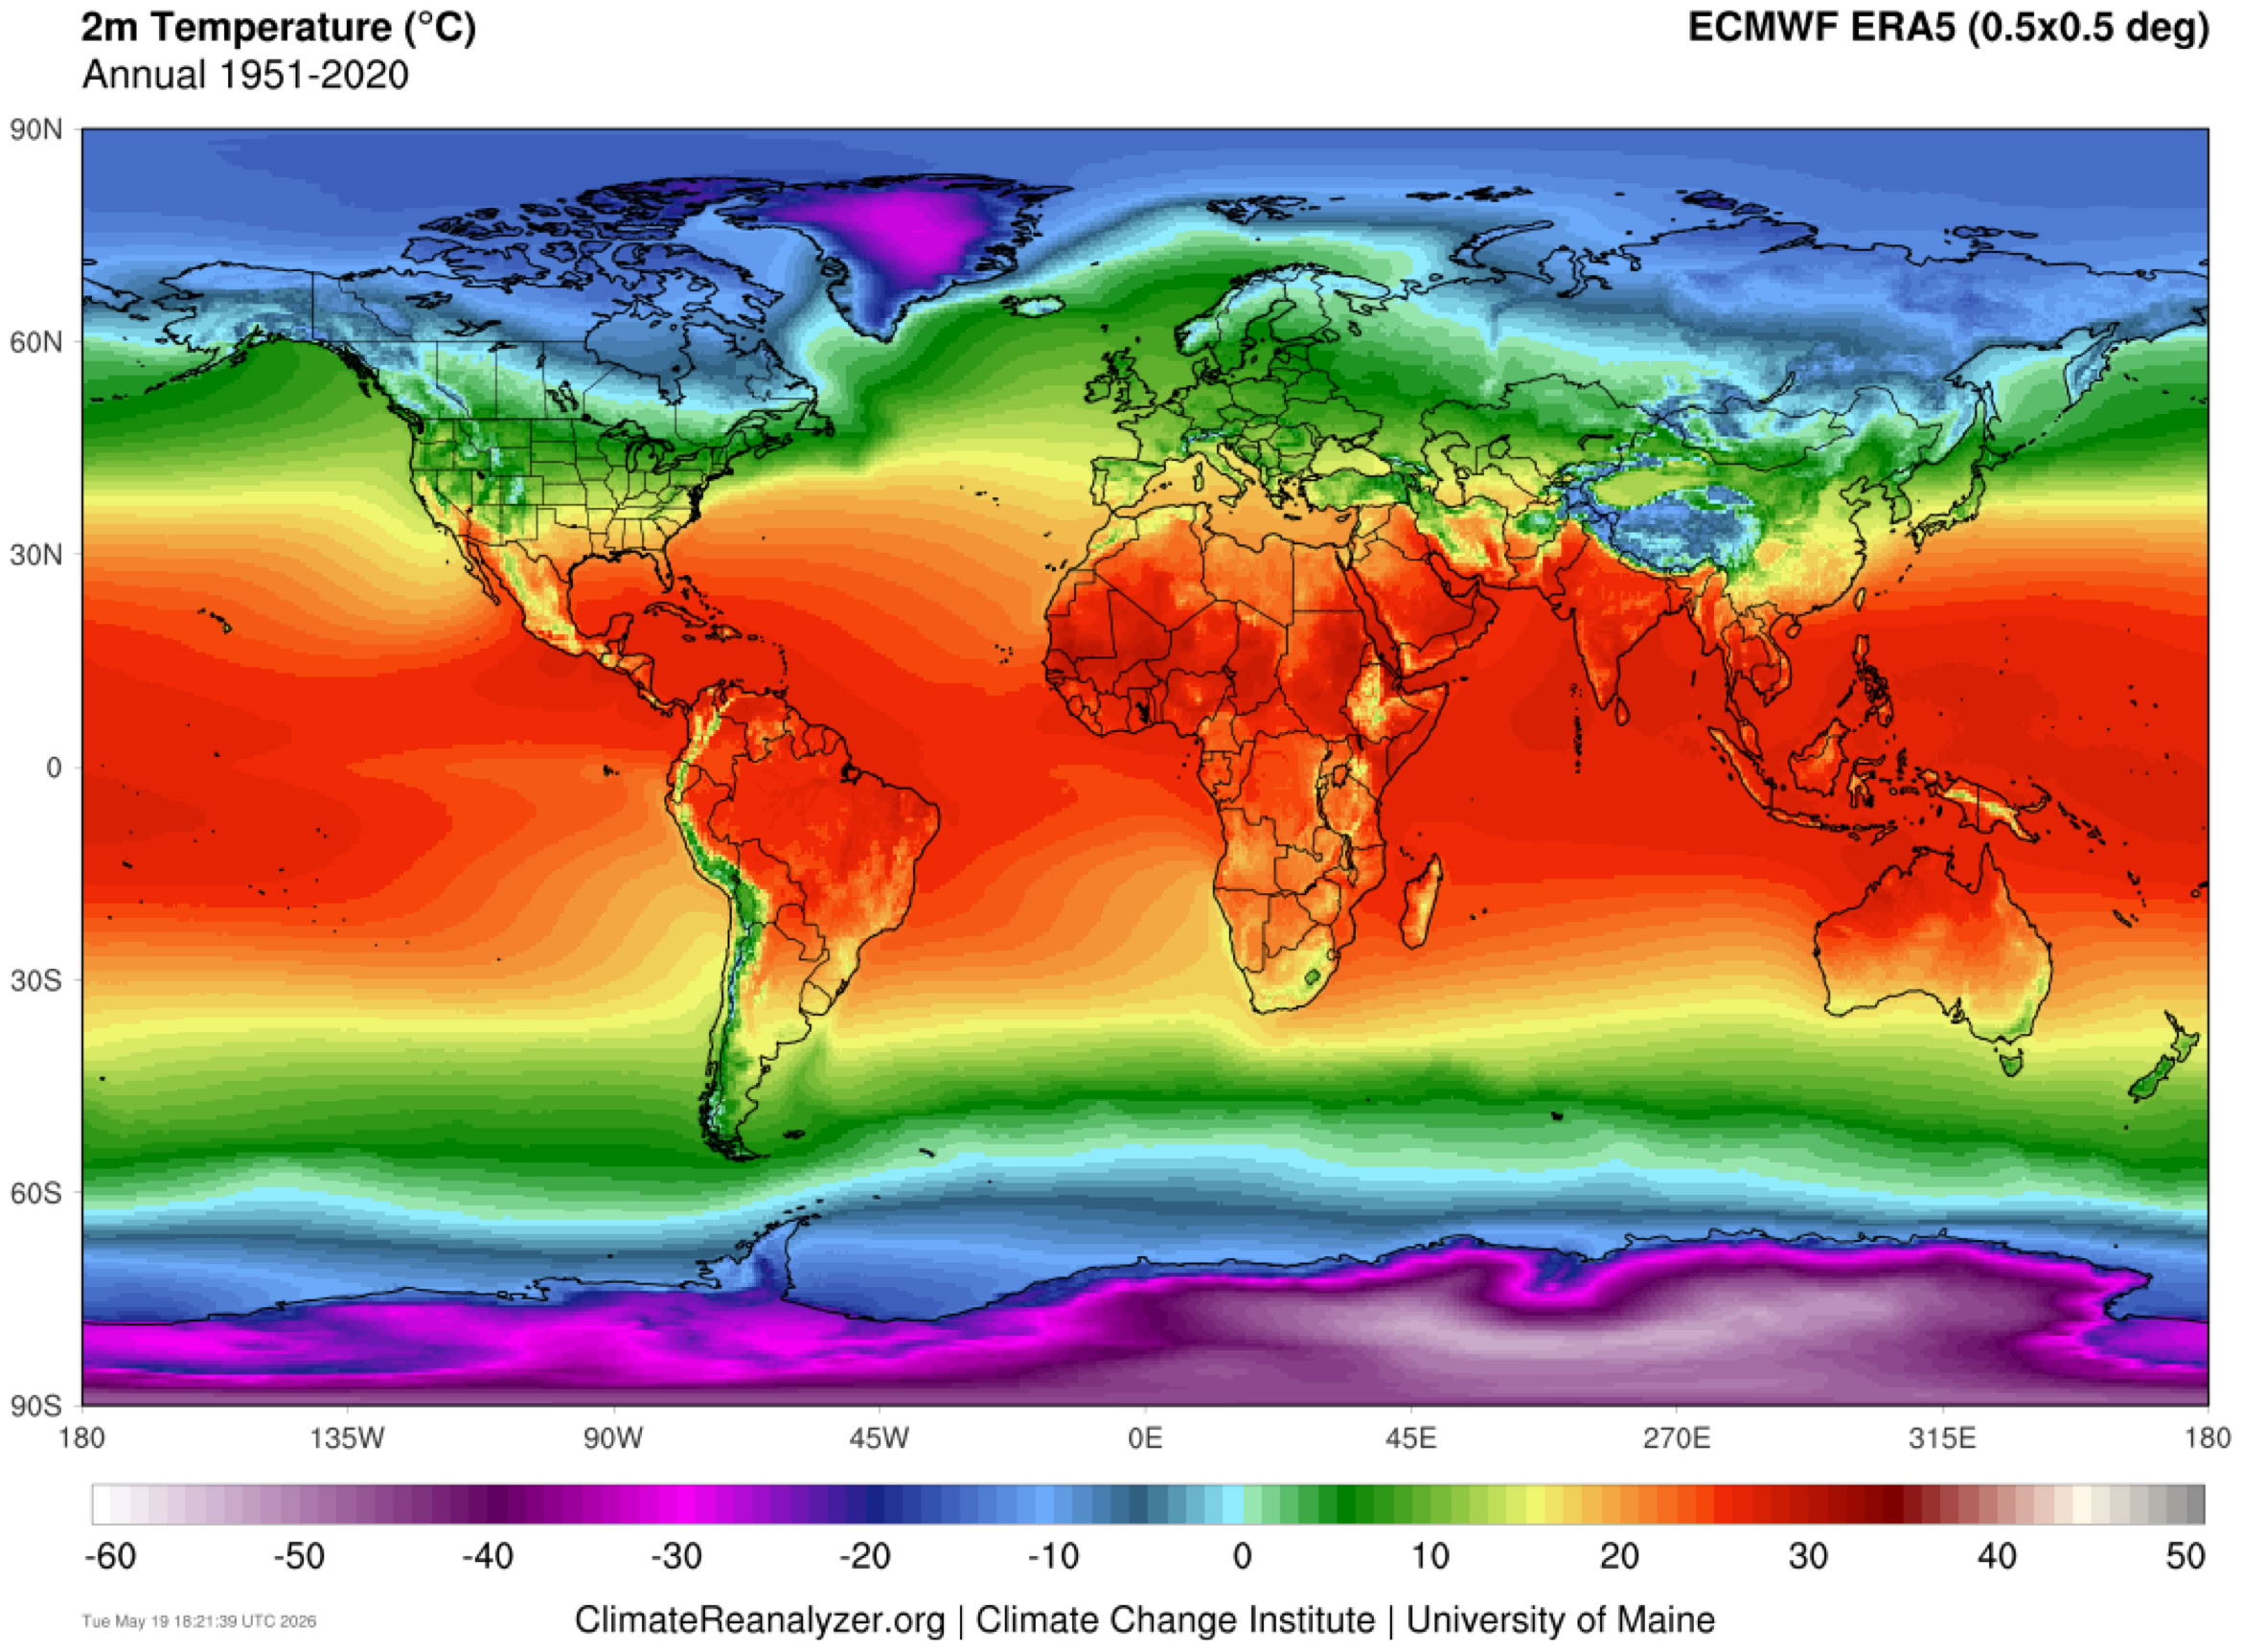
FIGURE 6.24 Global mean annual near-surface air temperature (2 meters above surface) averaged for 1951-2000. Note the influence of latitude on the pattern of surface temperature. The warmest temperatures are near the equator, while the coldest are near the poles. Image Source: Climate Reanalyzer (https://climatereanalyzer.org), Climate Change Institute, University of Maine, USA. The dataset used is ECMWF European Reanalysis V5 (ERA5) [0.5°x0.5°].


FIGURE 6.26 Global July near-surface air temperature (2 meters above surface) averaged for 1951-2000. Note the cooling of temperatures in the Southern Hemisphere middle and high latitudes and the warming of the Northern Hemisphere. Image Source: Climate Reanalyzer (https://climatereanalyzer.org), Climate Change Institute, University of Maine, USA. The dataset used is ECMWF European Reanalysis V5 (ERA5) [0.5°x0.5°].


FIGURE 6.28 Remote weather station buoy with a 6-meter (20-foot) boat-shaped hull. Image Source: NOAA.

FIGURE 6.25 Global January near-surface air temperature (2 meters above surface) averaged for 1951-2000. Note the cooling of temperatures in the Northern Hemisphere middle and high latitudes and the warming of the Southern Hemisphere. Image Source: Climate Reanalyzer (https://climatereanalyzer.org), Climate Change Institute, University of Maine, USA. The dataset used is ECMWF European Reanalysis V5 (ERA5) [0.5°x0.5°].
FIGURE 6.27 Global annual range in surface air temperature averaged for the period 1959-1997. Calculated by determining the difference between the highest and lowest average monthly mean temperature for 1959-1997. Image Source: Courtesy of J.J. Shinker, Department of Geography, University of Wyoming.

FIGURE 6.29 January and July monthly global sea surface temperature averages for 1951-2000. Image Source: Climate Reanalyzer (https://climatereanalyzer.org), Climate Change Institute, University of Maine, USA. The dataset used is ECMWF European Reanalysis V5 (ERA5) [0.5°x0.5°].