Figure 17.20 describes the average annual precipitation over fifty years (1951-2000) measured in millimeters per year over the surface of the Earth. The average annual precipitation of our planet’s entire surface is estimated to be about 1050 millimeters (41.3 in) per year or approximately 88 millimeters (3.5 in) per month. However, Figure 17.20 indicates that actual values show significant spatial variation, ranging from less than 100 millimeters (3.9 in) per year to more than 3000 millimeters (118 in) per year, depending on location. The reasons for these heterogeneous patterns are as follows:
- Deserts in subtropical regions have low precipitation because these areas generally lack mechanisms to lift air masses. These areas are dominated by subsiding air that results from global-scale circulation patterns (See Chapter 7, Figure 7.31). As a result, precipitation is minimal and infrequent. Usually, the lifting of air masses (rising air) results inadiabatic cooling. If the temperature drops enough, the air mass's humidity will condense into water droplets and ice crystals, forming clouds and possibly precipitation.
- Interior continental areas are dry because of their distance from moisture sources. Our planet’s oceans are the main source of water for precipitation.
- Polar areas are relatively dry because cold air cannot hold as much moisture as warm air. Because of global scale circulation patterns, polar regions are also dominated by subsiding air, which does not promote precipitation formation.
- Areas around the equator have high rainfall amounts because constant day-to-day solar heating encouragesconvectional lifting, and global-scale circulation patterns causeconvergence liftingwhen the air masses associated with the Trade Winds meet here. Together, these two mechanisms frequently lead to the development of thunderstorms along the Intertropical Convergence Zone (ITCZ).
- Between 30 and 60° of latitude, mid-latitude cyclones frequently develop. Along the warm and cold fronts associated with these storm systems, frontal lifting occurs when polar and subtropical air masses meet along the polar front. Mid-latitude cyclones and their associated air masses generally move from west to east, causing precipitation levels to decrease east of the oceanic moisture source regions.
- Mountain ranges near water sources can receive high quantities of precipitation because oforographic uplift. But this occurs only when prevailing winds push ocean-derived moisture over mountain barriers. Also associated with this process is a sharp reduction in precipitation in regions on the leeward slopes of these areas. This phenomenon is commonly known as the rainshadow effect.
Table 17.4 describes some of the precipitation extremes recorded at various locations worldwide. Figures 17.21 and 17.22 describe the January and July global precipitation patterns averaged over fifty years (1951-2000) and are measured in millimeters per month. Comparing these two periods (winter vs. summer) reveals some interesting seasonal patterns. In January (Figures 17.21), heavy precipitation occurs mainly south of the equator, from southern Africa eastward to Indonesia, and then across the northern part of the South Pacific Ocean. This precipitation is produced by tropical convergence and convection lifting mechanisms associated with the Intertropical Convergence Zone (ITCZ) and falls from many thunderstorms. A zone of higher precipitation circles the planet at about 50° south latitude. This precipitation is generated from the interaction of polar and subtropical air masses, which spawn mid-latitude cyclones. Mid-latitude cyclones are also responsible for higher levels of precipitation in two regions in the Northern Hemisphere: 1) from southern China across the middle of the Northern Pacific Ocean to the west coast of Canada and the United States; and 2) from the eastern United States to western Europe. Notable areas with low precipitation in January include the continental cores of Eurasia and North America, Mexico, North Africa, India, the Arctic and Antarctic, and the eastern parts of the major ocean basins in the Southern Hemisphere.
In July (Figure 17.22), the zone of high precipitation in the tropics shifts northward, bringing seasonal rains to Central America, northern South America, the middle of Africa, India, and Southeast Asia. In contrast, Southern Africa, western North America, Brazil, Australia, and the Mediterranean region all become significantly drier during this month. Mid-latitude cyclone activity in the Southern Hemisphere intensifies in July (winter), leading to higher precipitation than in January (summer). In the Northern Hemisphere, mid-latitude cyclone activity becomes less intense over the Pacific and Atlantic Oceans, leading to significant reductions in precipitation in these regions. Over the landmasses of North America and Europe, the higher temperatures of summer increase precipitation because mid-latitude cyclones interact with air masses with much higher moisture content. As we learned earlier in this chapter, air's ability to hold moisture increases significantly with temperature. Higher surface air temperatures and humidities over the land regions also lead to the formation of many summer thunderstorms, most of which are associated with mid-latitude cyclone cold fronts and dry lines.
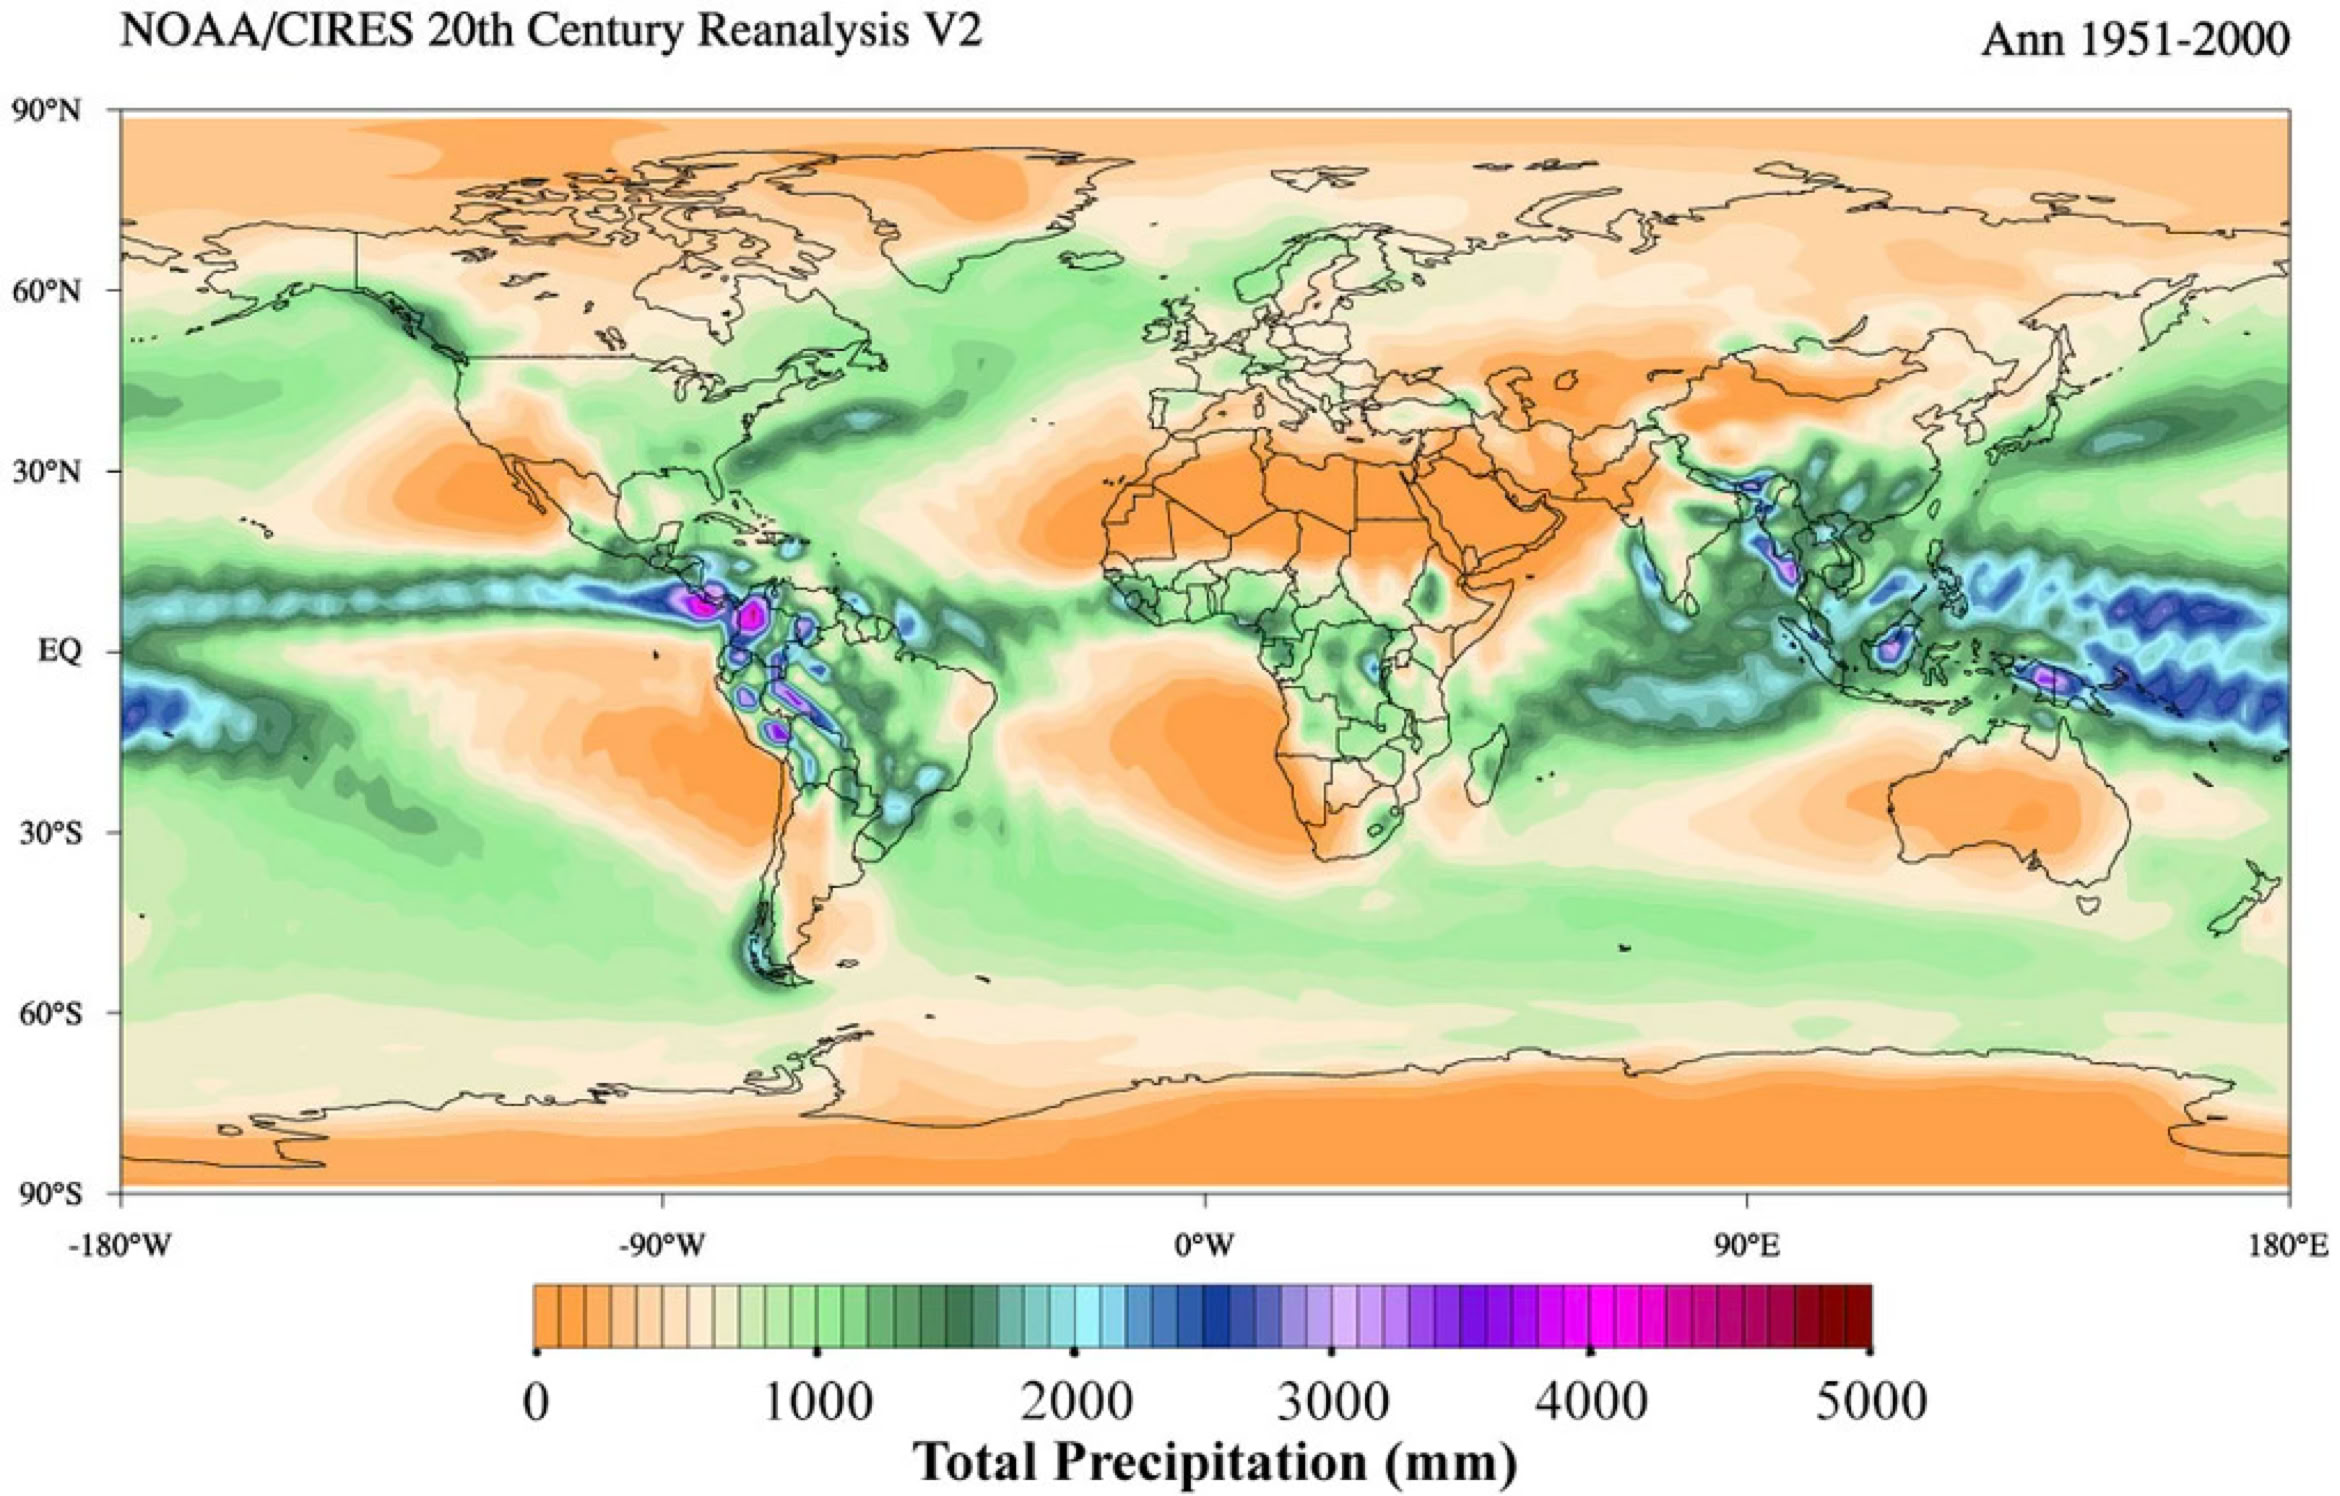
FIGURE 17.20 Average annual global precipitation for the period 1951-2000. The dataset used is NOAA 20th Century Reanalysis Version 2. Image Source: Climate Reanalyzer (https://climatereanalyzer.org), Climate Change Institute, University of Maine, USA.


FIGURE 17.21 Average January global precipitation for the period 1951-2000. The dataset used is NOAA 20th Century Reanalysis Version 2. Image Source: Climate Reanalyzer (https://climatereanalyzer.org), Climate Change Institute, University of Maine, USA.

FIGURE 17.22 Average July global precipitation for the period 1951-2000. The dataset used is NOAA 20th Century Reanalysis Version 2. Image Source: Climate Reanalyzer (https://climatereanalyzer.org), Climate Change Institute, University of Maine, USA.