
Introduction
The term humidity describes the fact that the atmosphere can contain water vapor. The amount of humidity in the air varies due to several factors. Two important factors are evaporation and condensation. Large amounts of liquid water evaporate into atmospheric water vapor at the water/atmosphere interface over our planet's oceans. This process is mainly caused by the absorption of solar radiation and the subsequent heat generation at the ocean's surface. Water vapor in our atmosphere is converted to liquid water when air masses cool and lose heat. This process is responsible for developing most clouds and producing rain that falls to the Earth's surface.
Mixing Ratio, Saturation Mixing Ratio, and Relative Humidity
Scientists have developed several different measures of atmospheric humidity. We are primarily interested in three measures: mixing ratio, saturation mixing ratio, and relative humidity. The mixing ratio is a measure that refers to the mass of a specific gas component relative to the mass of the remaining gaseous components for a sample of air. When used to measure humidity, the mixing ratio is the mass of water vapor relative to the mass of all other gases. In meteorological measurements, the mixing ratio is usually expressed in grams of water vapor per kilogram (g kg-1) ofdry air(dry airin this context refers to air with all the usual atmospheric gasesexceptwater vapor).
The saturation mixing ratio refers to the mass of water vapor that can be held in a kilogram ofdry airat saturation. Saturation can be generally defined as the condition where any addition of water vapor to a mass of air leads to the condensation of liquid water or the deposition of ice at a given temperature and pressure. The data in Table 17.1 indicate warmer air has a higher saturation mixing ratio than cooler air at a constant atmospheric pressure. It is important to note that this relationship between temperature and water vapor content in the air is not linear but exponential. In other words, for each 10° increase in temperature, the saturation mixing ratio increases by a larger quantity.
The most commonly used measure of humidity is relative humidity. Relative humidity can be defined as the amount of water in the air relative to the saturation amount the air can hold at a given temperature, multiplied by 100. Air with a relative humidity of 50% contains half the water vapor it could hold at that temperature. We can use the mixing and saturation mixing ratios to show how relative humidity is calculated for a specific air temperature. For example, we measure the mixing ratio in a mass of air with a temperature of 20°C to be 7.00 g kg-1. Using the equation below, we can now calculate the relative humidity of that air mass.
To perform this calculation, we must also look up the saturation mixing ratio for a temperature of 20°C (see Table 17.1). This value is 14.85 g kg-1. We multiplied by 100 to make the answer a percentage.
Figure 17.1 also illustrates the concept of relative humidity relative to measurements of mixing and saturation mixing ratios.
Dew Point and Frost Point
Relative humidity is associated with the dew point (if the dew point is below freezing, it is referred to as the frost point).The dew pointis the temperature at which water vapor becomes saturated in an air mass, turning it into liquid in the form of rain or dew. Dew differs from rain as it is a liquid deposit that forms on exposed objects with a significant surface area rather than minute particles in the atmosphere. A dew point typically occurs when a mass of air has a relative humidity of 100%. This situation happens in the atmosphere due to cooling through several different processes.
The frost point is equivalent to the dew point, except that it occurs at temperatures below freezing and produces snow or frost. It is crucial to recognize that frost is not frozen dew. Frost is the formation of an accumulation of tiny ice crystals that deposit themselves on objects when the air directly above the object reaches the frost point (Figure 17.2). Frozen dew would form as small beads of ice.
Measuring Humidity
Humidity can be measured using a variety of instruments. Relative humidity is often determined using a sling psychrometer or a hair hygrometer. A sling psychrometer is a device that consists of two thermometers joined to a piece of plastic or metal (Figure 17.3). One of the thermometers, the wet-bulb thermometer, has a small cloth hood (wick) pulled over the reservoir bulb. The other thermometer, called the dry-bulb thermometer, has no hood. At one end of the instrument is a rotating handle. To use the sling psychrometer, the wick is moistened with clean water, and the device is twirled in the air using the handle.
As the sling psychrometer is spun in the air, water evaporates from the wet-bulb thermometer, cooling it. The dryness of the air controls the amount of evaporation and cooling. If the air is saturated, the wet-bulb and dry-bulb thermometers would have the same temperature because no evaporation can occur. After a few minutes of twirling, the temperatures of the wet-bulb and dry-bulb thermometers are determined. A value called the wet-bulb depression is then calculated (dry-bulb minus wet-bulb temperature), and apsychrometric table (Table 17.2) is used to find the corresponding relative humidity from the values determined for dry-bulb temperature and wet-bulb depression.
For example, a sling psychrometer measures a dry-bulb temperature of 20°C and a wet-bulb temperature of 14°C for a mass of air. Using Table 17.2 and our measurements, we can calculate relative humidity using the following steps:
- Calculate the wet-bulb depression by taking the dry-bulb temperature and subtracting the wet-bulb temperature from it (20 - 16 = a wet-bulb depression of 4).
- Along the left-hand side of Table 17.2, find the row associated with the dry-bulb temperature of 20°C (air temperature) 5.
- Go down this row until you find the relative humidity value corresponding to a wet-bulb depression of 4°C. For this example, relative humidity is 66%.
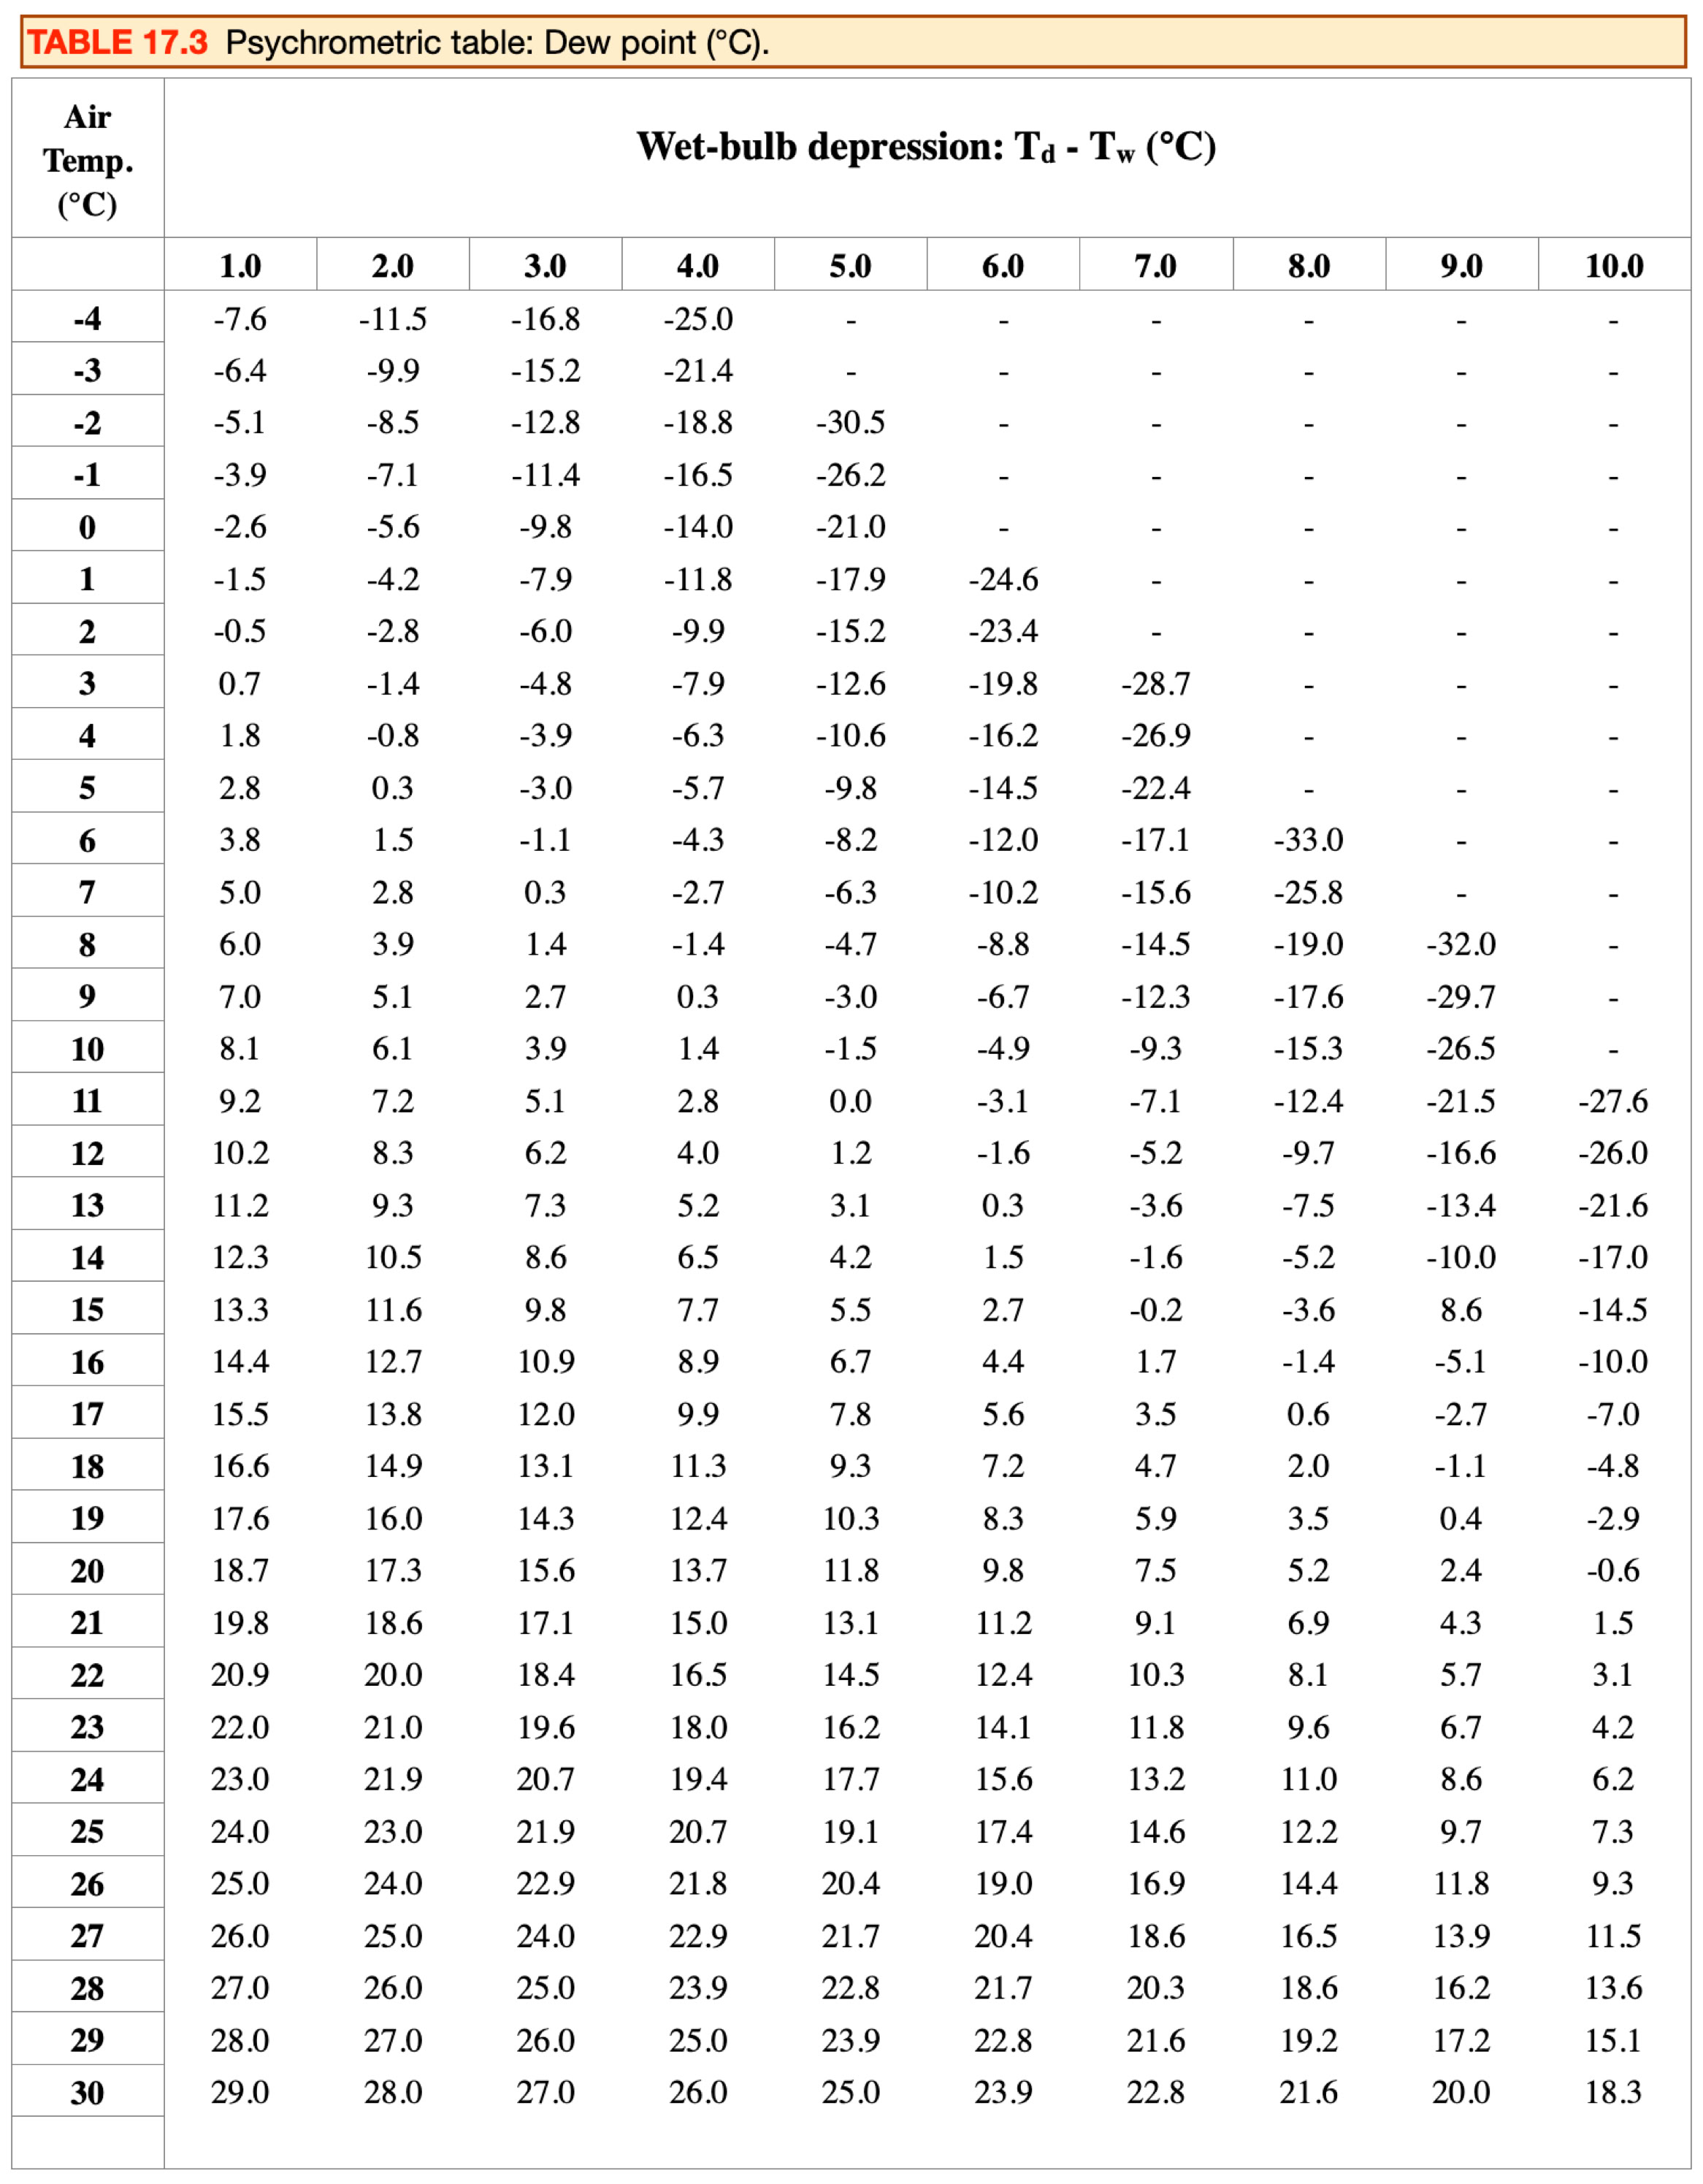
A psychrometric table is also available for calculating dew-point or frost-point temperatures (Table 17.3). To determine this value from our example measurements, we use the following steps:
- Calculate the wet-bulb depression by taking the dry-bulb temperature and subtracting the wet-bulb temperature from it (20 - 16 = a wet-bulb depression of 4).
- Along the left-hand side of Table 17.3, find the row associated with the dry-bulb temperature of 20°C (air temperature).
- Go down this row until you find the dew point temperature that corresponds to a wet-bulb depression of 4°C. For this example, the dew point is 13.7°C.
Hair hygrometers work on the fact that hair changes its length when humidity varies. This device usually consists of several human or horse hairs connected to a mechanical lever system. When humidity increases, hair becomes longer. This change in length is then transmitted and magnified by the lever system into a relative humidity measurement.
Global Measurements of Humidity
Humidity is also measured globally using sensors placed on satellites (Figure 17.4). The GOES series of satellites can detect water concentration in the troposphere at altitudes between 4 and 12 kilometers (2.5 to 7.5 mi). A sensor on this satellite measures the effect water vapor has on infrared radiation emitted by the Earth. Water vapor can absorb and reradiate this type of radiation. Water vapor imagery from the GOES series of satellites plays an important role in monitoring climate conditions (like the formation of thunderstorms and hurricanes), which in turn aids in developing weather forecasts.
NASA's Aqua satellite is another important satellite used to measure water vapor in the Earth's atmosphere. This satellite has been operational since 2002. Aqua measures atmospheric water vapor using the AIRS (Atmospheric Infrared Sounder) sensor. AIRS uses advanced infrared technology to produce 3-dimensional maps of water vapor (Figures 17.5 and 17.6).
Condensation, Freezing, and Deposition
We have learned that water is available on the Earth in the following three forms: vapor, liquid, and solid. The process of water moving from one of these forms to another is called aphaseorstate change. In the atmosphere, three processes create water droplets or ice crystals. These three processes are:
Condensation - water changing from a gaseous form to liquid droplets.
Freezing - water being transferred from a liquid to a solid state.
Deposition - water being converted from a vapor to a solid form.
Heat energy must be added to or removed from water molecules for a phase change to occur. Water droplets and ice crystals form when water in the atmosphere cools. As air containing water vapor cools, the relative humidity of the air parcel increases until the dew or frost point is reached. Water condenses into droplets at the dew point (relative humidity = 100%). At 100% relative humidity, deposition occurs below 0°C (32°F), and ice crystals form.
The formation of water droplets and ice crystals also requires a surface for condensation, freezing, or deposition. These surfaces are microscopic particles of dust, smoke, and salt in the atmosphere, commonly called condensation nuclei. Deposition nuclei, six-sided particles, are needed to form ice crystals. If nuclei are deficient, super-saturation can result, and condensation, freezing, or deposition can only occur with a relative humidity greater than 100%.


FIGURE 17.1 The following illustration describes how relative humidity changes in a parcel of air with increased air temperature. At 10°C, a parcel of dry air weighing one kilogram can hold a maximum of 7.76 grams of water vapor (see Table 17.1). In this state, the air parcel would be saturated, with a relative humidity of 100%. Increasing the temperature of this parcel without adding or removing any water would increase its capacity to hold water vapor. According to Table 17.1, a 10°C rise in temperature would increase the saturation mixing ratio of this parcel of air to 14.85 grams. Since no water has been added or removed, the parcel's actual amount would remain 7.76 grams. This quantity is known as the mixing ratio. Dividing the mixing ratio by the saturation mixing ratio and multiplying by 100 gives the relative humidity of the air parcel (7.76/14.85 × 100 = 52%). At 20°C, the relative humidity would be 52%. Raising the parcel of air's temperature by another 10°C would again lower its relative humidity. In this state, the actual mixing ratio would still be 7.76 grams, while the saturation mixing ratio would increase to 27.69 grams. Relative humidity would drop to 28% at a temperature of 30°C (7.76/27.69 x 100 = 28%). Image Copyright: Michael Pidwirny.

FIGURE 17.3 Sling psychrometer. Note that the wet-bulb thermometer is located at the bottom. Image Copyright: Michael Pidwirny.

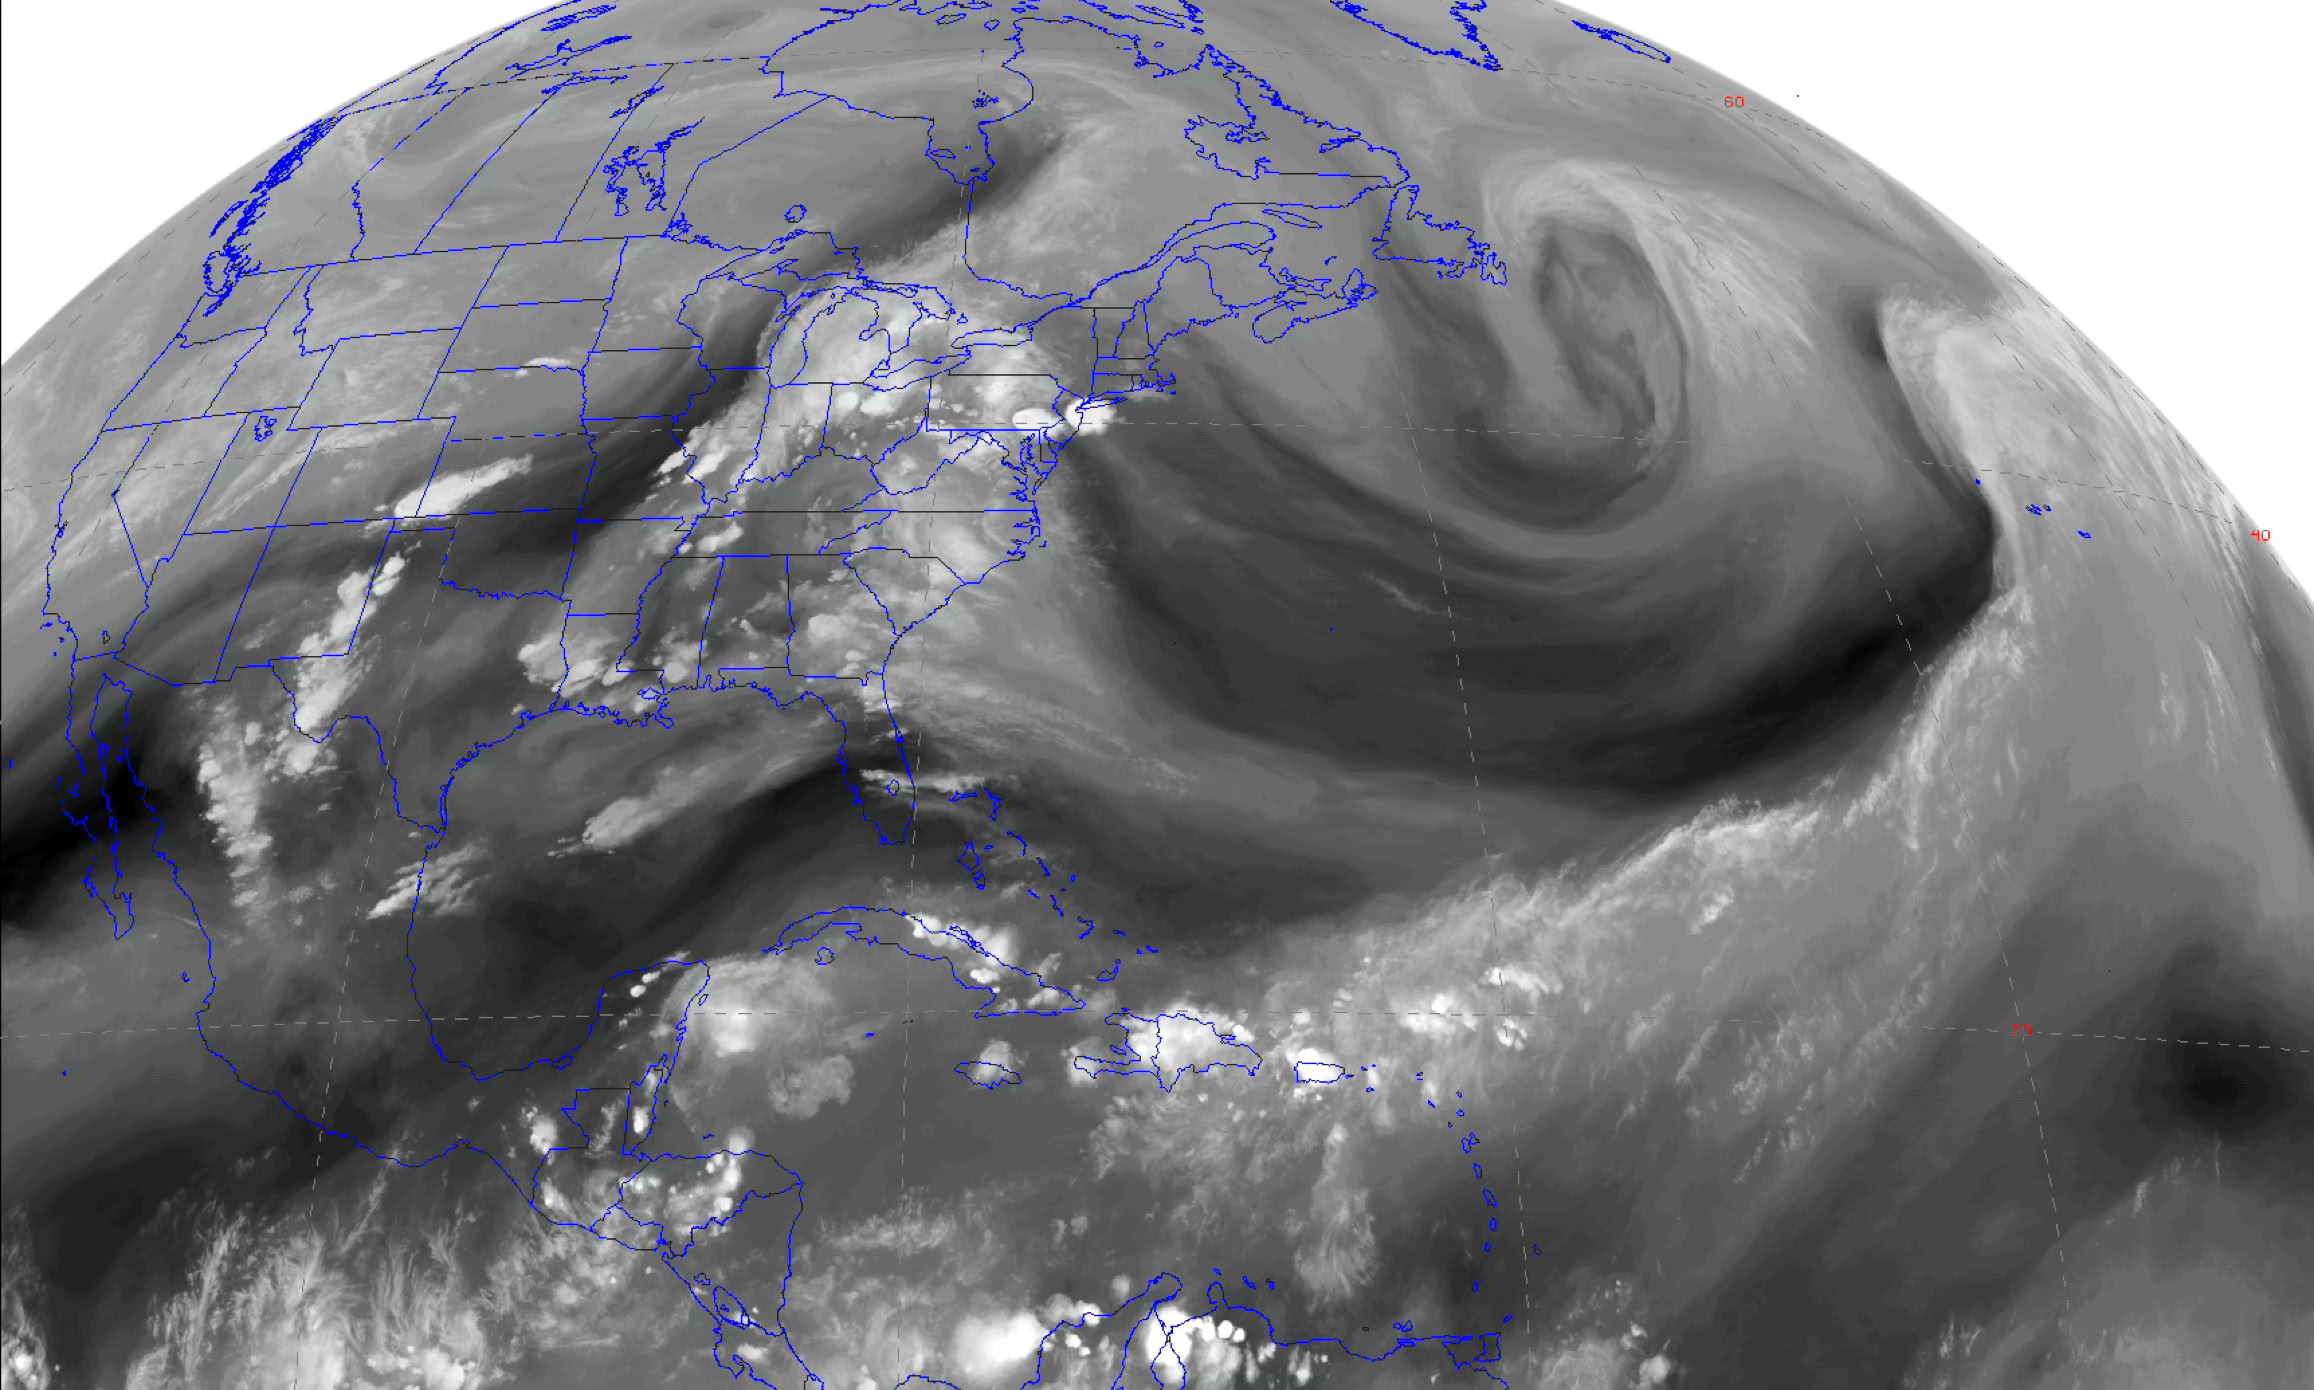
FIGURE 17.4 GOES-East satellite image of atmospheric water vapor over Canada, the United States, Mexico, and Central America. Light-toned areas have high vapor content, while dark regions have low water vapor concentrations. This image is for 22:45 Greenwich Mean Time (GMT), May 31, 2010. Image Source: NOAA - GOES East Image Viewer.

FIGURE 17.5 Global distribution of water vapor for January 2003 from the Earth's surface to the top of the atmosphere as measured in millimeters of precipitable water. During January, the atmosphere contains low amounts of water vapor over North America and Eurasia, which are experiencing winter. The highest water vapor concentrations are found over the equator, Brazil, Indonesia, northern Australia, the Indian Ocean, and the western side of the South Pacific Ocean in the tropics and subtropics. Image Source: NASA's Atmospheric Infrared Sounder.

FIGURE 17.6 Global distribution of water vapor for July 2003 from the Earth's surface to the top of the atmosphere as measured in millimeters of precipitable water. Compared to January, North America and Eurasia see a significant increase in atmospheric water vapor. Areas with the highest water vapor concentrations are found over the equator, India, Southeast Asia, the Indian Ocean, the Gulf of Mexico, central Africa, the western side of the North Pacific Ocean at the tropics and subtropics, and along the East coast of the USA. Image Source: NASA's Atmospheric Infrared Sounder.
FIGURE 17.2 Frost crystals on blades of grass. Image Source: Wikimedia Commons, photo by Andrew Dunn. This image is licensed under the Creative Commons Attribution-Share Alike 2.0 Generic license.